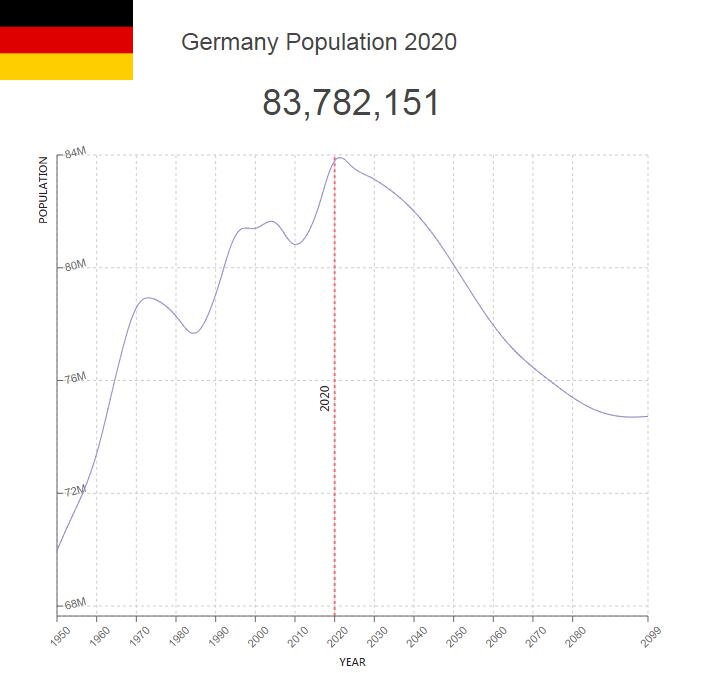
Germany Population
Germany has played a key role in world history. The country is the world’s fourth largest economy, and one of the EU’s leading powers.
Key figures and facts
- Capital: Berlin
- Ethnic groups: Germans 92%, Turks 2%, others 6%
- Language: German
- Religion: Catholics 29%, Protestants 27%, Muslims 4%, Orthodox Christians 2%, Other/None/Unspecified 38% (2015)
- Population: 82 114 000 (2017)
- Control Form: Federal Republic
- Area: 357 170 km²
- Currency: euro
- GNP per capita: 48 861 PPP $
- National Day: October 3rd
Population of Germany
Germany’s population is composed of several peoples. Most originate in the old Germanic tribes, the North Sea coastal friezes, the (Lower) Saxons in the north between the Elbe and the Rhine, the Franks in the Rhine area, the Alemans in the southwest and the Bavarians in the southeast. From approximately year 500 AD was landed east of a line from Kiel across the Thuringian Forest to the Bohemian Forest inhabited by Slavs people, who were later displaced eastward. Around 900, the border of the German area ran along the Elbe and Saale rivers, but land reclamation and colonization continued further east until the mid-1300s. The boundary between German and Slavic settlement then remained roughly unchanged until the Second World War. After the defeat in 1945, the areas east of the rivers Oder and Neisse were laid under Polish, and North-East Prussia under Soviet administration and the German population were displaced.
Population of Germany by Year (Historical)
| Year | Population | Annual Growth Rate | Population Density | Global Rank |
| 2020 | 83,783,831 | 0.320% | 240.3716 | 19 |
| 2019 | 83,516,934 | 0.470% | 239.6059 | 17 |
| 2018 | 83,124,307 | 0.560% | 238.4795 | 17 |
| 2017 | 82,658,298 | 0.560% | 237.1426 | 16 |
| 2016 | 82,193,657 | 0.500% | 235.8095 | 16 |
| 2015 | 81,787,300 | 0.240% | 234.6437 | 16 |
| 2010 | 80,826,891 | -0.190% | 231.8884 | 16 |
| 2005 | 81,602,630 | 0.050% | 234.1139 | 14 |
| 2000 | 81,400,771 | 0.060% | 233.5348 | 12 |
| 1995 | 81,138,548 | 0.520% | 232.7825 | 12 |
| 1990 | 79,053,873 | 0.350% | 226.8016 | 12 |
| 1985 | 77,691,484 | -0.150% | 222.8930 | 11 |
| 1980 | 78,282,989 | -0.150% | 224.5900 | 9 |
| 1975 | 78,855,928 | 0.070% | 226.2338 | 8 |
| 1970 | 78,578,274 | 0.600% | 225.4372 | 8 |
| 1965 | 76,257,921 | 0.760% | 218.7802 | 8 |
| 1960 | 73,414,128 | 0.520% | 210.6215 | 7 |
| 1955 | 71,537,348 | 0.440% | 205.2371 | 7 |
| 1950 | 69,966,132 | 0.000% | 200.7294 | 6 |
Major Cities in Germany by Population
| Rank | City | Population |
| 1 | Berlin | 3,426,243 |
| 2 | Hamburg | 1,739,006 |
| 3 | Munich | 1,260,280 |
| 4 | Koeln | 963,284 |
| 5 | Frankfurt am Main | 649,889 |
| 6 | Essen | 592,974 |
| 7 | Stuttgart | 589,682 |
| 8 | Dortmund | 588,351 |
| 9 | Duesseldorf | 572,946 |
| 10 | Bremen | 546,390 |
| 11 | Hannover | 515,029 |
| 12 | Leipzig | 504,860 |
| 13 | Duisburg | 504,247 |
| 14 | Nuernberg | 499,126 |
| 15 | Dresden | 486,743 |
| 16 | Wandsbek | 411,311 |
| 17 | Bochum | 385,618 |
| 18 | Bochum-Hordel | 379,889 |
| 19 | Wuppertal | 360,686 |
| 20 | Bielefeld | 331,795 |
| 21 | Bonn | 313,014 |
| 22 | Mannheim | 307,849 |
| 23 | Marienthal | 286,990 |
| 24 | Karlsruhe | 283,688 |
| 25 | Hamburg-Nord | 279,889 |
| 26 | Wiesbaden | 272,321 |
| 27 | Muenster | 270,073 |
| 28 | Gelsenkirchen | 269,917 |
| 29 | Aachen | 265,097 |
| 30 | Moenchengladbach | 261,631 |
| 31 | Augsburg | 259,085 |
| 32 | Eimsbuettel | 251,796 |
| 33 | Altona | 250,081 |
| 34 | Chemnitz | 247,109 |
| 35 | Braunschweig | 244,604 |
| 36 | Krefeld | 237,873 |
| 37 | Halle (Saale) | 233,996 |
| 38 | Hamburg-Mitte | 233,033 |
| 39 | Kiel | 232,647 |
| 40 | Magdeburg | 229,715 |
| 41 | Neue Neustadt | 226,740 |
| 42 | Oberhausen | 219,065 |
| 43 | Freiburg | 215,855 |
| 44 | Luebeck | 212,096 |
| 45 | Erfurt | 203,143 |
| 46 | Harburg | 202,460 |
| 47 | Hagen | 198,861 |
| 48 | Rostock | 198,182 |
| 49 | Kassel | 194,390 |
| 50 | Hamm | 185,216 |
| 51 | Mainz | 184,886 |
| 52 | Saarbruecken | 181,116 |
| 53 | Herne | 171,997 |
| 54 | Muelheim | 170,889 |
| 55 | Neukoelln | 167,137 |
| 56 | Osnabrueck | 166,351 |
| 57 | Solingen | 164,248 |
| 58 | Ludwigshafen am Rhein | 163,085 |
| 59 | Leverkusen | 162,627 |
| 60 | Oldenburg | 159,107 |
| 61 | Neuss | 152,346 |
| 62 | Prenzlauer Berg Bezirk | 148,767 |
| 63 | Bezirk Kreuzberg | 147,421 |
| 64 | Potsdam | 145,181 |
| 65 | Heidelberg | 143,234 |
| 66 | Paderborn | 142,050 |
| 67 | Darmstadt | 140,274 |
| 68 | Wuerzburg | 133,620 |
| 69 | Regensburg | 129,040 |
| 70 | Wolfsburg | 122,953 |
| 71 | Recklinghausen | 122,327 |
| 72 | Goettingen | 122,038 |
| 73 | Heilbronn | 120,622 |
| 74 | Ingolstadt | 120,547 |
| 75 | Ulm | 120,340 |
| 76 | Bottrop | 119,798 |
| 77 | Charlottenburg Bezirk | 119,746 |
| 78 | Bergedorf | 119,554 |
| 79 | Pforzheim | 119,202 |
| 80 | Offenbach | 119,081 |
| 81 | Friedrichshain Bezirk | 117,718 |
| 82 | Bremerhaven | 117,335 |
| 83 | Remscheid | 117,007 |
| 84 | Berlin Schoeneberg | 116,175 |
| 85 | Schoneberg Bezirk | 115,865 |
| 86 | Nippes | 113,376 |
| 87 | Reutlingen | 112,516 |
| 88 | Furth | 111,914 |
| 89 | Moers | 107,705 |
| 90 | Koblenz | 107,208 |
| 91 | Siegen | 107,131 |
| 92 | Bergisch Gladbach | 106,073 |
| 93 | Jena | 104,601 |
| 94 | Gera | 104,548 |
| 95 | Marzahn | 103,657 |
| 96 | Hildesheim | 102,941 |
| 97 | Erlangen | 102,564 |
| 98 | Witten | 101,136 |
| 99 | Salzgitter | 100,968 |
| 100 | Trier | 100,018 |
| 101 | Zwickau | 98,685 |
| 102 | Kaiserslautern | 98,621 |
| 103 | Iserlohn | 97,799 |
| 104 | Schwerin | 96,530 |
| 105 | Guetersloh | 96,069 |
| 106 | Wilmersdorf Bezirk | 94,002 |
| 107 | Dueren | 93,329 |
| 108 | Esslingen | 92,279 |
| 109 | Ratingen | 91,495 |
| 110 | Marl | 91,287 |
| 111 | Luenen | 90,898 |
| 112 | Hanau am Main | 88,537 |
| 113 | Velbert | 87,558 |
| 114 | Ludwigsburg | 87,492 |
| 115 | Flensburg | 85,727 |
| 116 | Gesundbrunnen | 84,678 |
| 117 | Cottbus | 84,643 |
| 118 | Wilhelmshaven | 84,282 |
| 119 | Tuebingen | 83,305 |
| 120 | Minden | 82,768 |
| 121 | Villingen-Schwenningen | 81,659 |
| 122 | Konstanz | 81,164 |
| 123 | Mitte | 81,094 |
| 124 | Worms | 80,988 |
| 125 | Lichterfelde | 80,038 |
| 126 | Dorsten | 79,870 |
| 127 | Luedenscheid | 79,275 |
| 128 | Marburg an der Lahn | 78,784 |
| 129 | Neumuenster | 78,272 |
| 130 | Wedding Bezirk | 78,179 |
| 131 | Castrop-Rauxel | 77,813 |
| 132 | Bogenhausen | 77,431 |
| 133 | Dessau | 77,204 |
| 134 | Gladbeck | 76,829 |
| 135 | Arnsberg | 76,501 |
| 136 | Rheine | 76,380 |
| 137 | Viersen | 76,042 |
| 138 | Delmenhorst | 75,782 |
| 139 | Reinickendorf | 75,303 |
| 140 | Bayreuth | 74,950 |
| 141 | Hellersdorf | 74,736 |
| 142 | Troisdorf | 74,638 |
| 143 | Giessen | 74,300 |
| 144 | Bocholt | 73,832 |
| 145 | Detmold | 73,569 |
| 146 | Steglitz Bezirk | 72,353 |
| 147 | Norderstedt | 71,328 |
| 148 | Lueneburg | 71,149 |
| 149 | Celle | 70,899 |
| 150 | Moabit | 70,800 |
| 151 | Dinslaken | 70,462 |
| 152 | Bamberg | 69,936 |
| 153 | Aschaffenburg | 68,440 |
| 154 | Neubrandenburg | 67,971 |
| 155 | Lippstadt | 67,108 |
| 156 | Aalen | 66,974 |
| 157 | Neuwied | 66,694 |
| 158 | Unna | 66,623 |
| 159 | Plauen | 66,301 |
| 160 | Herten | 65,195 |
| 161 | Herford | 64,768 |
| 162 | Grevenbroich | 64,668 |
| 163 | Weimar | 64,616 |
| 164 | Kerpen | 64,115 |
| 165 | Fulda | 63,649 |
| 166 | Dormagen | 63,471 |
| 167 | Bergheim | 63,447 |
| 168 | Garbsen | 63,244 |
| 169 | Wesel | 61,574 |
| 170 | Kempten (Allgaeu) | 61,288 |
| 171 | Schwabisch Gmund | 61,227 |
| 172 | Sindelfingen | 61,200 |
| 173 | Landshut | 60,377 |
| 174 | Rosenheim | 60,056 |
| 175 | Kopenick Bezirk | 60,017 |
| 176 | Brandenburg an der Havel | 59,715 |
| 177 | Ruesselsheim | 59,619 |
| 178 | Berlin Koepenick | 59,450 |
| 179 | Langenfeld | 59,267 |
| 180 | Offenburg | 59,127 |
| 181 | Stralsund | 58,865 |
| 182 | Stolberg | 58,763 |
| 183 | Hameln | 58,555 |
| 184 | Zehlendorf Bezirk | 58,358 |
| 185 | Menden | 58,340 |
| 186 | Friedrichshafen | 58,292 |
| 187 | Goeppingen | 57,929 |
| 188 | Goerlitz | 57,640 |
| 189 | Pankow | 57,002 |
| 190 | Hattingen | 56,755 |
| 191 | Tempelhof Bezirk | 56,558 |
| 192 | Hilden | 56,454 |
| 193 | Sankt Augustin | 55,983 |
| 194 | Eschweiler | 55,667 |
| 195 | Ahlen | 55,169 |
| 196 | Bad Salzuflen | 54,788 |
| 197 | Euskirchen | 54,778 |
| 198 | Meerbusch | 54,715 |
| 199 | Wolfenbuettel | 54,629 |
| 200 | Huerth | 54,567 |
| 201 | Baden-Baden | 54,128 |
| 202 | Schweinfurt | 53,901 |
| 203 | Neustadt | 53,873 |
| 204 | Pulheim | 53,651 |
| 205 | Neu-Hohenschoenhausen | 53,263 |
| 206 | Gummersbach | 53,020 |
| 207 | Waiblingen | 52,834 |
| 208 | Nordhorn | 52,692 |
| 209 | Greifswald | 52,620 |
| 210 | Cuxhaven | 52,566 |
| 211 | Wetzlar | 52,545 |
| 212 | Bergkamen | 52,218 |
| 213 | Bad Homburg vor der Hoehe | 51,748 |
| 214 | Willich | 51,732 |
| 215 | Frankfurt (Oder) | 51,580 |
| 216 | Emden | 51,415 |
| 217 | Neu-Ulm | 51,278 |
| 218 | Lingen | 51,199 |
| 219 | Winterhude | 51,186 |
| 220 | Erftstadt | 51,096 |
| 221 | Neubrueck | 50,998 |
| 222 | Ibbenbueren | 50,466 |
| 223 | Passau | 50,449 |
| 224 | Langenhagen | 50,328 |
| 225 | Schwerte | 50,288 |
| 226 | Speyer | 50,232 |
| 227 | Heidenheim an der Brenz | 49,956 |
| 228 | Berlin Treptow | 49,889 |
| 229 | Peine | 49,842 |
| 230 | Mariendorf | 49,806 |
| 231 | Neunkirchen | 49,732 |
| 232 | Bad Oeynhausen | 49,402 |
| 233 | Lichtenrade | 49,378 |
| 234 | Hof | 49,128 |
| 235 | Friedrichsfelde | 48,998 |
| 236 | Kleve | 48,961 |
| 237 | Ravensburg | 48,714 |
| 238 | Frechen | 48,622 |
| 239 | Elmshorn | 48,592 |
| 240 | Bornheim | 48,412 |
| 241 | Soest | 47,926 |
| 242 | Rastatt | 47,795 |
| 243 | Erkrath | 47,704 |
| 244 | Weissensee | 47,582 |
| 245 | Stuttgart-Ost | 47,389 |
| 246 | Duelmen | 47,384 |
| 247 | Frankenthal | 47,327 |
| 248 | Herzogenrath | 47,270 |
| 249 | Loerrach | 46,891 |
| 250 | Albstadt | 46,553 |
| 251 | Gotha | 46,504 |
| 252 | Melle | 46,403 |
| 253 | Alsdorf | 46,229 |
| 254 | Boeblingen | 46,171 |
| 255 | Gronau | 46,050 |
| 256 | Rheda-Wiedenbrueck | 46,012 |
| 257 | Neustadt am Ruebenberge | 45,831 |
| 258 | Kamen | 45,816 |
| 259 | Leonberg | 45,600 |
| 260 | Singen | 45,585 |
| 261 | Stade | 45,523 |
| 262 | Hennef | 45,298 |
| 263 | Buende | 45,292 |
| 264 | Meiderich | 45,186 |
| 265 | Wismar | 45,144 |
| 266 | Amberg | 44,626 |
| 267 | Erkelenz | 44,539 |
| 268 | Homburg | 44,496 |
| 269 | Straubing | 44,469 |
| 270 | Halle Neustadt | 44,404 |
| 271 | Bruehl | 44,026 |
| 272 | Fellbach | 43,824 |
| 273 | Lehrte | 43,809 |
| 274 | Nordhausen | 43,801 |
| 275 | Lahr | 43,752 |
| 276 | Eisenach | 43,735 |
| 277 | Hoyerswerda | 43,570 |
| 278 | Freiberg | 43,559 |
| 279 | Pirmasens | 43,471 |
| 280 | Goslar | 43,449 |
| 281 | Filderstadt | 43,439 |
| 282 | Suhl | 43,398 |
| 283 | Weinheim | 43,214 |
| 284 | Rodgau | 43,204 |
| 285 | Bad Kreuznach | 43,102 |
| 286 | Monheim am Rhein | 42,927 |
| 287 | Gifhorn | 42,889 |
| 288 | Bruchsal | 42,674 |
| 289 | Rottenburg | 42,610 |
| 290 | Alt-Hohenschoenhausen | 42,498 |
| 291 | Freising | 42,459 |
| 292 | Staaken | 42,455 |
| 293 | Weiden | 42,439 |
| 294 | Kaufbeuren | 42,394 |
| 295 | Oberursel | 42,337 |
| 296 | Nettetal | 42,306 |
| 297 | Kaarst | 42,001 |
| 298 | Wunstorf | 41,969 |
| 299 | Eberswalde | 41,869 |
| 300 | Bautzen | 41,861 |
| 301 | Lemgo | 41,832 |
| 302 | Coburg | 41,790 |
| 303 | Bietigheim-Bissingen | 41,658 |
| 304 | Muelheim | 41,600 |
| 305 | Landau in der Pfalz | 41,501 |
| 306 | Heinsberg | 41,394 |
| 307 | Seevetal | 41,155 |
| 308 | Lankwitz | 41,131 |
| 309 | Koenigswinter | 41,053 |
| 310 | Memmingen | 41,024 |
| 311 | Voelklingen | 41,021 |
| 312 | Borken | 40,765 |
| 313 | Rudow | 40,691 |
| 314 | Oranienburg | 40,682 |
| 315 | Pinneberg | 40,466 |
| 316 | Dreieich | 40,256 |
| 317 | Pirna | 40,211 |
| 318 | Aurich | 40,208 |
| 319 | Barmbek-Nord | 40,150 |
| 320 | Nurtingen | 40,099 |
| 321 | Kirchheim unter Teck | 40,095 |
| 322 | Laatzen | 39,927 |
| 323 | Hueckelhoven | 39,717 |
| 324 | Dachau | 39,629 |
| 325 | Halberstadt | 39,618 |
| 326 | Schorndorf | 39,586 |
| 327 | Neumarkt in der Oberpfalz | 39,446 |
| 328 | Mettmann | 39,439 |
| 329 | Loehne | 39,410 |
| 330 | Kamp-Lintfort | 39,379 |
| 331 | Britz | 39,377 |
| 332 | Bensheim | 39,328 |
| 333 | Siegburg | 39,024 |
| 334 | Gallus | 39,019 |
| 335 | Freital | 38,916 |
| 336 | Ettlingen | 38,831 |
| 337 | Voerde | 38,648 |
| 338 | Warendorf | 38,596 |
| 339 | Sankt Ingbert | 38,586 |
| 340 | Altenburg | 38,457 |
| 341 | Schwabach | 38,443 |
| 342 | Westend | 38,390 |
| 343 | Buckow | 38,363 |
| 344 | Saarlouis | 38,222 |
| 345 | Maintal | 38,202 |
| 346 | Buxtehude | 38,081 |
| 347 | Ahaus | 38,054 |
| 348 | Muehlhausen | 37,997 |
| 349 | Schwedt (Oder) | 37,890 |
| 350 | Neustadt/Sued | 37,828 |
| 351 | Beckum | 37,703 |
| 352 | Haltern | 37,677 |
| 353 | Hofheim am Taunus | 37,639 |
| 354 | Stendal | 37,611 |
| 355 | Wilhelmstadt | 37,513 |
| 356 | Hemer | 37,391 |
| 357 | Falkensee | 37,357 |
| 358 | Buchholz in der Nordheide | 37,293 |
| 359 | Riesa | 37,045 |
| 360 | Wuerselen | 36,963 |
| 361 | Germering | 36,723 |
| 362 | Wermelskirchen | 36,705 |
| 363 | Leinfelden-Echterdingen | 36,561 |
| 364 | Coesfeld | 36,520 |
| 365 | Schwaebisch Hall | 36,432 |
| 366 | Niederkassel | 36,369 |
| 367 | Porta Westfalica | 36,253 |
| 368 | Datteln | 36,227 |
| 369 | Kempen | 36,201 |
| 370 | Lage | 35,986 |
| 371 | Lurup | 35,942 |
| 372 | Gropiusstadt | 35,941 |
| 373 | Backnang | 35,667 |
| 374 | Falkenhagener Feld | 35,631 |
| 375 | Pasing | 35,617 |
| 376 | Wesseling | 35,554 |
| 377 | Emsdetten | 35,471 |
| 378 | Langen | 35,305 |
| 379 | Neu Isenburg | 35,182 |
| 380 | Markisches Viertel | 35,119 |
| 381 | Zweibruecken | 35,110 |
| 382 | Sinsheim | 35,108 |
| 383 | Greven | 34,969 |
| 384 | Uelzen | 34,885 |
| 385 | Bernau bei Berlin | 34,755 |
| 386 | Tuttlingen | 34,736 |
| 387 | Merseburg | 34,669 |
| 388 | Steinfurt | 34,490 |
| 389 | Spandau | 34,395 |
| 390 | Wernigerode | 34,352 |
| 391 | Balingen | 34,303 |
| 392 | Schoenebeck | 34,190 |
| 393 | Tegel | 34,176 |
| 394 | Meppen | 34,087 |
| 395 | Papenburg | 34,006 |
| 396 | Geldern | 33,902 |
| 397 | Kehl | 33,898 |
| 398 | Vegesack | 33,889 |
| 399 | Juelich | 33,800 |
| 400 | Leer | 33,775 |
The largest minority groups in Germany today – apart from immigrants – are approximately 60,000 Sorbians living around the towns of Cottbus and Bautzen in the east and approximately 30,000 Danes in Schleswig-Holstein, especially in and around Flensburg.
Population growth after 1900 is characterized by the two world wars. After the First World War, the population slowly rose and for periods of time stagnated. After the Nazis came to power, measures were taken, among other things. to increase the birth rate, and the population increased noticeably. The land divisions in the east and the division of Germany after the Second World War had dramatic consequences. The entire German population was expelled from Poland, Czechoslovakia and Hungary and from the abandoned areas east of the Oder-Neisse line. Also, there was mass escape from most Eastern European countries. During the end of the war and in the years that followed, the German population east of Oder-Neisse and in Eastern Europe was reduced from 17 to 2.6 million. that families and friends were split and had to live on under two different systems. After the split, the population in East Germany fell, while West Germany experienced strong growth.
The population decline in East Germany, which had 19 million residents in 1948, was primarily due to the large refugee flow to West Germany, especially in the first years after the war. During the period 1944–61, more than 3 million people fled from East to West Germany. Most of those who left East Germany during this period were at their most fertile age. Consequently, a fall in the frequency of births had long-lasting consequences. West Germany, on the other hand, experienced strong population growth in the first years after the war. In the period 1945–50, West Germany received close to 10 million refugees from East Germany, from former German territories in the East and from other parts of Eastern Europe. Throughout the 1950s, the influx of refugees from East Germany stayed up, while the number of refugees/exiles from other areas declined. When the Berlin Wall was built in 1961, also stopped the flow of refugees from eastern Germany. In the period 1945–61, a total of 13.5 million people had immigrated to West Germany, the largest refugee stream in European history.
Throughout the 1960s, West Germany experienced an ever-increasing labor deficit, mainly as a result of strong economic growth, increased educational propensity and lower retirement age. The solution became “import” of labor, so-called Gastarbeider. Most came from the Mediterranean countries, with Turkey, Yugoslavia, Italy and Greece as the main country. In addition, since the 1980s, a large number of refugees and asylum seekers from more distant countries, such as Iran and Afghanistan, have arrived.. The wars in Yugoslavia in the early 1990s also led to a mass escape from there which primarily went to Germany. The number of asylum seekers reached a peak in 1992 with over 438,000 applications. The requirements were tightened by a new law in 1993, and the number of new applicants has then steadily dropped to 62,000 in 2004.
The political upheavals in Eastern Europe and the former Soviet Union around 1990 also led to a flood of refugees to Germany, which peaked in the late autumn of 1989 with the fall of the Berlin Wall. In 1989, a total of 842,000 refugees arrived in West Germany, of which 721,000 were of German descent. In the period 1987-94 almost 2 million German “Aussiedler” came from the east. Germany is thus the country in Europe that has welcomed the most immigrants of different categories. In 2006, the country had a total population of approximately 82.4 million of these were approximately 7.5 million foreigners, the largest groups from Turkey (1.75 million), the former Yugoslavia, Italy, Greece, the former Soviet Union and Poland. Ethnically, the population is distributed on an estimated 68 million of German descent and over 14 million with other origins.
Germany has had a negative natural growth since the 1970s (born ÷ dead). This is mainly due to the strong decrease in the birth rate from approximately 17 1960 in 1960 to approximately 8.5 ‰ in 2004, while mortality in the same period has decreased significantly, from approximately 12 ‰ to approximately 10 ‰. Developments in this area have also been different in the two parts of the country. In the 1980s, the GDR had a positive growth, West Germany a negative growth and with such a margin that it overall produced a negative result. Since 1991, the birth deficit has varied between 1.0 1,5 and 1.5 ‰. Because of. immigration nevertheless increased the population until 2003. Since then it has declined slightly because the immigration surplus has declined sharply, from approximately 780,000 in 1992 to approximately 82,000 in 2004.
After the reunification in 1990, well over 1 million people have moved from the former GDR area to West Germany, so that the population in 2004 divided by approximately 65.5 million in West Germany, 13.4 million in East Germany and 3.4 million in total Berlin.
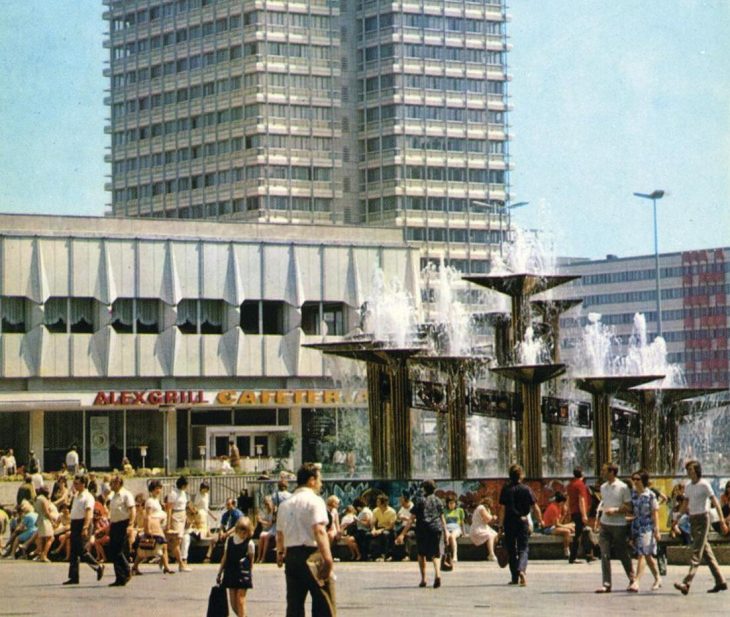
In 2011, Germany had a population density of 229 residents per km², but large geographical differences with the largest population concentration in the Rhein- Ruhr area with a closely related urban area from Bonn and Cologne in the south to Dortmund and Hamm in the northeast. Similar urban regions are the Rhein-Main area with Frankfurt, Mainz and Wiesbaden, the Rhein-Neckar area with Mannheim and Ludwigshafen, and the industrial area around Stuttgart. Also the areas around the major Saxon cities of Halle, Leipzig and Chemnitz and around other major cities such as Bremen and Hamburg, Hanover, Dresden, Munich and Nuremberg are very densely populated. Berlin, which had a total population of 3–3.5 million during the entire partition period, has long since resumed its capital functions, but the population has nevertheless not increased significantly (3.5 million in 2012).
Relatively thinly populated are many border areas such as Emsland, Eifel, Hunsrück, Bayerischer Wald and Oberpfalz, but also larger inland areas with relatively poor soil such as Lüneburger Heide and large parts of Brandenburg. The large mountain and forest areas (including the Alps and the Black Forest) are mostly sparsely populated. Also, many areas on both sides of the former border between East and West Germany were heavily depopulated during the partition period. The rural population is in many places gathered in large centers where different services are easily accessible. This is especially true in the eastern states, where such development was promoted through the agricultural policy of the GDR.
Administrative divisions
| Location | Capital | Area km² | Residents (2011) |
| Baden-Wurttemberg | Stuttgart | 35,751 | 10 786 227 |
| Bayern | Munich | 70 550 | 12 595 891 |
| Berlin | – | 888 | 3 501 872 |
| Brandenburg | Potsdam | 29 483 | 2 495 635 |
| Bremen | Bremen | 419 | 661 301 |
| Hamburg | – | 755 | 1 798 836 |
| Hesse | Wiesbaden | 21 115 | 6 092 126 |
| Mecklenburg-Vorpommern | Schwerin | 23 191 | 1 634 734 |
| Lower Saxony | Hannover | 47 613 | 7 913 502 |
| North Rhine-Westphalia | Dusseldorf | 34 092 | 17 841 956 |
| Rhineland-Palatinate | Mainz | 19 854 | 3 999 117 |
| Saarland | Saarbrücken | 2 568 | 1 013 352 |
| Saxony | Dresden | 18 420 | 4 137 051 |
| Saxony-Anhalt | Magdeburg | 20 450 | 2 313 280 |
| Schleswig-Holstein | Kiel | 15 799 | 2 837 641 |
| Thuringia | Erfurt | 16 172 | 2 221 222 |


