Marshall Islands Population
The Marshall Islands have had close ties to the United States since World War II. The countries have an agreement on free relations, which gives the United States responsibility for the Marshall Islands defense. US aid also plays a crucial role in the Marshall Islands economy.
Key figures and facts
- Capital: Majuro
- Ethnic groups: Marshallese 92.1%, mixed Marshallese 5.9%, other 2% (2006)
- Language: Marshallese (official) 98.2%, other languages 1.8% (English (official) widely used as a second language) (1999)
- Religion: Protestants 80.5% (various groups) Roman Catholic 8.5%, Mormon 7%, Jehovah’s Witnesses 1.7%, other/none 3.2% (2011)
- Population: 53 167
- Control Form: Constitutional authorities in free association with the US
- Area: 180 km2
- Currency: American dollar
- GNP per capita: 4 023 PPP $
- National Day: May 1st
Marshall Islands Population
The population of the Marshall Islands was estimated at 52,600 in 2013 (World Bank). In the 1990s, the fertility rate was 7 births per woman and was among the highest in the world. In the early 2000s, it had dropped to 5.7. Nearly 40 percent of the population is under 15. Teenage pregnancies are very frequent. Child mortality has risen sharply since the late 1980s, from 26 per 1,000 in 1986 to 63 per 1,000 in 1988 and 68 in 2003. Life expectancy in 2000 was 67.8 years for women and 62.8 years for men.
Parts of the population are still affected by the effects of the nuclear tests on the Bikini and Enewetak atolls in the years 1946–1958. The test blasts, among other things, led to radioactive fallout among the residents of Rongelap and Utik, and a 1995 report indicated that 40 percent of the residents who were moved from Rongelap suffer from cancer.
97 percent of the population is Micronesians. The others are Americans and Asians.
Around 2/3 of the population is concentrated in the two urban population centers, the capital Dalap-Uliga-Darrit on the atoll Majuro and Ebeye Island in Kwajalein Atoll.
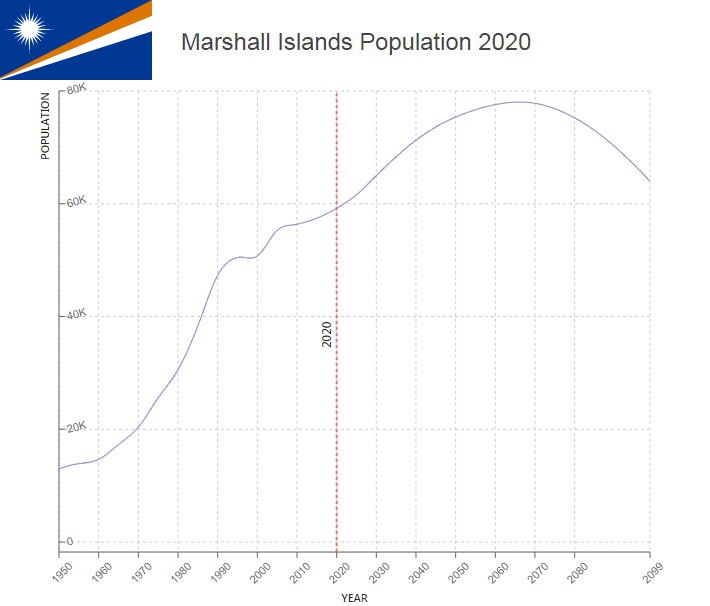
Population of Marshall Islands by Year (Historical)
| Year | Population | Annual Growth Rate | Population Density | Global Rank |
| 2020 | 59,079 | 0.680% | 328.8333 | 207 |
| 2019 | 58,680 | 0.650% | 326.6167 | 207 |
| 2018 | 58,302 | 0.610% | 324.5167 | 207 |
| 2017 | 57,947 | 0.560% | 322.5444 | 207 |
| 2016 | 57,624 | 0.520% | 320.7500 | 207 |
| 2015 | 57,328 | 0.380% | 319.1056 | 207 |
| 2010 | 56,255 | 0.400% | 313.1444 | 208 |
| 2005 | 55,147 | 1.710% | 306.9889 | 209 |
| 2000 | 50,642 | 0.120% | 281.9611 | 209 |
| 1995 | 50,346 | 1.310% | 280.3167 | 208 |
| 1990 | 47,160 | 4.280% | 262.6167 | 209 |
| 1985 | 38,222 | 4.630% | 212.9611 | 210 |
| 1980 | 30,465 | 3.640% | 169.8667 | 210 |
| 1975 | 25,465 | 4.630% | 142.0889 | 211 |
| 1970 | 20,284 | 3.370% | 113.3056 | 214 |
| 1965 | 17,173 | 3.350% | 96.0222 | 215 |
| 1960 | 14,551 | 1.080% | 81.4556 | 214 |
| 1955 | 13,783 | 1.340% | 77.1889 | 214 |
| 1950 | 12,890 | 0.000% | 72.2278 | 214 |
Major Cities in Marshall Islands by Population
| Rank | City | Population |
| 1 | Majuro | 25,289 |
| 2 | Ebaye | 14,889 |
| 3 | Arno | 1,957 |
| 4 | Jabor | 1,089 |
| 5 | Wotje | 769 |
| 6 | Mili | 743 |
| 7 | Namdrik | 703 |
| 8 | Ebon | 603 |
| 9 | Kili | 491 |
| 10 | Likiep | 371 |
| 11 | Ailuk | 340 |
| 12 | Ujae | 337 |
| 13 | Aur | 327 |
| 14 | Utrik | 298 |
| 15 | Lae | 208 |
| 16 | Mejit | 189 |
Religion
The population is mainly Protestant. Religious minorities include Catholics, Jehovah’s Witnesses, Adventists, Baptists, and adherents to the Bahai religion.
Language
Official languages are English and Marshallese. The population speaks Marshallese, which belongs to the Micronesian languages of the Austronesian language family.


