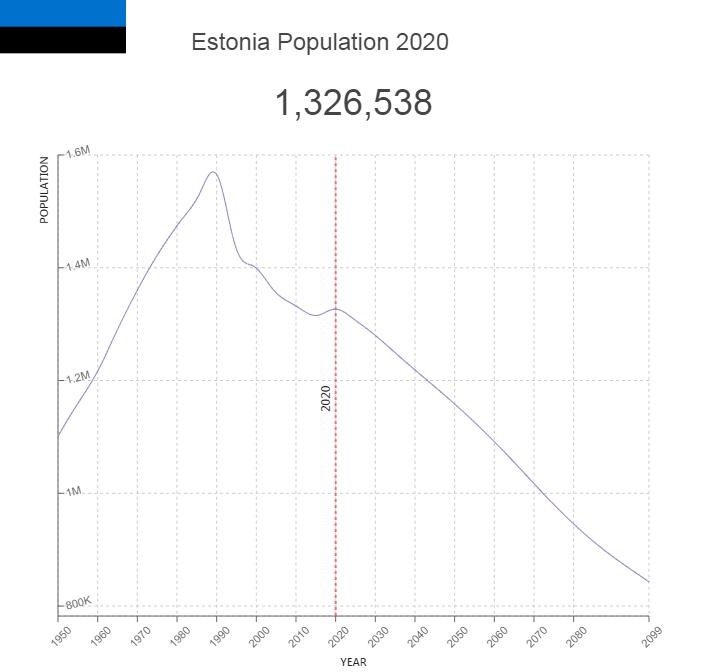
Estonia Population
Since the fall of the Soviet Union, Estonia’s policy has been oriented towards the EU and the West, while the economy has grown considerably. Relations with Russia are poor.
Key figures and facts
- Capital: Tallinn
- Ethnic groups: Estonian 68.7%, Russian 24.8%, Ukrainian 1.7%, Belarusian 1%, Finns 0.6%, other/unspecified 3.2% (2011)
- Language: Estonian 68.5%, Russian 29.6%, Ukrainian 0.6%, other/unspecified 1.3% (2011)
- Religion: Protestants 9.9%, Orthodox 16.2%, other Christians 2.2%, other 0.9, none 54.1%, unspecified 16.7% (2011)
- Population: 1 280 227
- Control Form: Republic
- Area: 45,227 km2
- Currency: euro
- GNP per capita: 29 743 PPP $
- National Day: February 24th
Estonia People
Estonia has 1,318,700 residents (2018). Life expectancy at birth as of 2018 is 82.3 years for women and 73.7 years for men. In the period from 2008 to 2018, life expectancy for women increased by ten years and for men by six years. The difference between life expectancy for women and men was reduced from 12 years in 1994 to 8.6 years in 2018.
Population of Estonia by Year (Historical)
| Year | Population | Annual Growth Rate | Population Density | Global Rank |
| 2020 | 1,326,424 | 0.070% | 31.2936 | 155 |
| 2019 | 1,325,537 | 0.210% | 31.2727 | 155 |
| 2018 | 1,322,809 | 0.270% | 31.2083 | 154 |
| 2017 | 1,319,279 | 0.220% | 31.1250 | 154 |
| 2016 | 1,316,399 | 0.090% | 31.0571 | 154 |
| 2015 | 1,315,214 | -0.250% | 31.0291 | 154 |
| 2010 | 1,331,990 | -0.350% | 31.4249 | 152 |
| 2005 | 1,355,537 | -0.630% | 31.9804 | 150 |
| 2000 | 1,399,001 | -0.480% | 33.0057 | 148 |
| 1995 | 1,432,913 | -1.750% | 33.8057 | 148 |
| 1990 | 1,565,135 | 0.560% | 36.9249 | 146 |
| 1985 | 1,522,289 | 0.640% | 35.9141 | 144 |
| 1980 | 1,474,328 | 0.730% | 34.7827 | 142 |
| 1975 | 1,421,932 | 0.890% | 33.5467 | 140 |
| 1970 | 1,360,091 | 1.060% | 32.0878 | 137 |
| 1965 | 1,290,285 | 1.180% | 30.4411 | 135 |
| 1960 | 1,216,708 | 0.970% | 28.7053 | 134 |
| 1955 | 1,159,120 | 1.040% | 27.3468 | 133 |
| 1950 | 1,100,884 | 0.000% | 25.9730 | 132 |
Major Cities in Estonia by Population
| Rank | City | Population |
| 1 | Tallinn | 393,913 |
| 2 | Tartu | 100,981 |
| 3 | Narva | 66,869 |
| 4 | Kohtla-Jaerve | 45,949 |
| 5 | Paernu | 44,081 |
| 6 | Viljandi | 20,198 |
| 7 | Rakvere | 16,625 |
| 8 | Sillamaee | 16,561 |
| 9 | Maardu | 16,519 |
| 10 | Kuressaare | 14,810 |
| 11 | Voru | 14,520 |
| 12 | Valga | 13,834 |
| 13 | Haapsalu | 11,694 |
| 14 | Johvi | 11,358 |
| 15 | Paide | 9,624 |
| 16 | Keila | 9,300 |
| 17 | Kivioli | 6,842 |
| 18 | Tapa | 6,440 |
| 19 | Polva | 6,393 |
| 20 | Jogeva | 6,285 |
| 21 | Tueri | 6,027 |
| 22 | Elva | 5,708 |
| 23 | Rapla | 5,573 |
| 24 | Saue | 4,911 |
| 25 | Kaerdla | 3,652 |
Population trends
Before World War II, the population was relatively homogeneous. According to the census in 1934, 88.1 percent were esters, while 8.2 percent were Russians, 1.5 percent Germans and 0.7 percent Swedes.
The Russians lived in the east, the Germans mostly in the cities and Swedes along the coast and on the islands in the northwest (see Estonian Swedes). The annexation, war, deportation and escape of the Soviet Union reduced the Estonian population by 25 percent, from 1,136,000 in 1939 to 854,000 in 1945. One consequence of the war was that most Germans and Swedes emigrated to Germany and Sweden respectively, and right after the war the esters made up 97.3 percent of the population.
After 1945, massive immigration to Estonia from other regions of the Soviet Union took place. However, since Estonia declared its independence in 1991, the Estonian proportion of the country’s population has increased to 68.7 percent (2018). The five largest minority groups are: Russians 24.8 percent, Ukrainians 1.7 percent, Belarusians 1.0 percent and find 1 percent.
An average of 1.6 children are born per woman. Due to, among other things, emigration, the age structure of the population and the low birth rates, the Estonian statistical agency expects that the country’s population will be reduced by 125,000 people over the next 30 years.
To increase the working population of the population, the retirement age, which for 2018 is 63.5 years for men and women, will gradually be increased to 65 years in 2024.
In 2017, 67.4 percent of the population lived in urban areas. The largest cities are Tallinn, Tartu, Narva, Kohtla-Järve, Pärnu and Viljandi.
Language
Official language is Estonian, which is the native language of 68.5 percent of the population. 29.6 percent of the population has Russian as their mother tongue.


