Sri Lanka Population
The tropical island of Sri Lanka was ravaged by civil war for over 25 years. Since the peace in 2009, conditions have improved and the economy has grown, but the minority group of Tamils is still experiencing discrimination.
Key figures and facts
- Capital: Colombo
- Ethnic groups: Sinhalese 74.9%, Sri Lankan Tamils 11.2%, Sri Lankan Moors 9.2%, Indian Tamils 4.2%, other 0.5% (2012)
- Language: Sinhalese (official and national language) 87%, Tamil (national language) 28.5%, English 23.8% (2012)
- Religion: Buddhists (official religion) 70.2%, Hindus 12.6%, Muslims 9.7%, Catholics 6.1%, other Christians 1.3% (2012)
- Population: 20 950 041 (2018)
- Control Form: Semi-presidential republic
- Area: 65 610 km2
- Currency: Sri Lankan Rupee
- GNP per capita: 12 313 PPP $
- National Day: February 4th
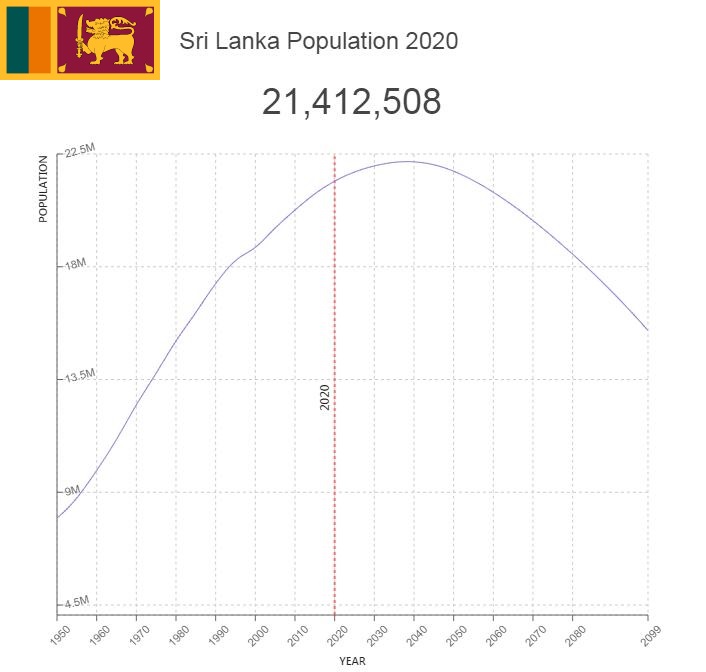
Population of Sri Lanka
The population of Sri Lanka in 2017 was estimated at 22.4 million. The country has seen a declining population growth in recent years. Population growth was 0.76 percent in 2017. However, the birth rate has been declining, and has contributed to a lower population growth. Life expectancy (in 2017) is 80.6 years for women and 73.5 years for men.
Population of Sri Lanka by Year (Historical)
| Year | Population | Annual Growth Rate | Population Density | Global Rank |
| 2020 | 21,413,138 | 0.420% | 341.4647 | 58 |
| 2019 | 21,323,622 | 0.450% | 340.0372 | 58 |
| 2018 | 21,228,652 | 0.480% | 338.5228 | 58 |
| 2017 | 21,127,921 | 0.510% | 336.9165 | 58 |
| 2016 | 21,021,060 | 0.540% | 335.2124 | 57 |
| 2015 | 20,907,916 | 0.630% | 333.4082 | 57 |
| 2010 | 20,261,626 | 0.720% | 323.1022 | 59 |
| 2005 | 19,544,877 | 0.800% | 311.6726 | 54 |
| 2000 | 18,777,490 | 0.580% | 299.4355 | 52 |
| 1995 | 18,242,801 | 1.040% | 290.9091 | 49 |
| 1990 | 17,325,662 | 1.380% | 276.2840 | 48 |
| 1985 | 16,176,169 | 1.470% | 257.9538 | 45 |
| 1980 | 15,035,723 | 1.800% | 239.7677 | 43 |
| 1975 | 13,755,035 | 1.960% | 219.3453 | 43 |
| 1970 | 12,485,629 | 2.360% | 199.1028 | 43 |
| 1965 | 11,110,709 | 2.390% | 177.1778 | 43 |
| 1960 | 9,874,365 | 2.380% | 157.4625 | 45 |
| 1955 | 8,778,327 | 1.950% | 139.9847 | 45 |
| 1950 | 7,970,987 | 0.000% | 127.1105 | 44 |
Major Cities in Sri Lanka by Population
| Rank | City | Population |
| 1 | Colombo | 647,923 |
| 2 | Dehiwala-Mount Lavinia | 219,716 |
| 3 | Moratuwa | 184,920 |
| 4 | Jaffna | 168,991 |
| 5 | Negombo | 137,112 |
| 6 | Pita Kotte | 118,068 |
| 7 | Sri Jayewardenepura Kotte | 115,715 |
| 8 | Kandy | 111,590 |
| 9 | Trincomalee | 108,309 |
| 10 | Kalmunai | 100,060 |
| 11 | Galle | 93,007 |
| 12 | Point Pedro | 89,699 |
| 13 | Batticaloa | 86,631 |
| 14 | Katunayaka | 84,532 |
| 15 | Valvedditturai | 78,094 |
| 16 | Matara | 76,143 |
| 17 | Battaramulla South | 75,522 |
| 18 | Dambulla | 66,605 |
| 19 | Maharagama | 66,465 |
| 20 | Kotikawatta | 64,454 |
| 21 | Anuradhapura | 60,832 |
| 22 | Vavuniya | 60,065 |
| 23 | Kolonnawa | 57,965 |
| 24 | Hendala | 56,867 |
| 25 | Ratnapura | 47,721 |
| 26 | Badulla | 47,476 |
| 27 | Puttalam | 45,550 |
| 28 | Devinuwara | 44,889 |
| 29 | Welisara | 41,195 |
| 30 | Kalutara | 37,889 |
| 31 | Bentota | 36,889 |
| 32 | Matale | 36,351 |
| 33 | Homagama | 34,553 |
| 34 | Beruwala | 34,139 |
| 35 | Panadura | 33,624 |
| 36 | Mulleriyawa | 33,429 |
| 37 | Kandana | 33,313 |
| 38 | Ja Ela | 32,064 |
| 39 | Wattala | 30,614 |
| 40 | Peliyagoda | 30,606 |
| 41 | Kelaniya | 28,735 |
| 42 | Kurunegala | 28,460 |
| 43 | Nuwara Eliya | 25,664 |
| 44 | Gampola | 24,619 |
| 45 | Chilaw | 24,601 |
| 46 | Eravur Town | 22,871 |
| 47 | Hanwella Ihala | 22,807 |
| 48 | Weligama | 22,068 |
| 49 | Vakarai | 20,889 |
| 50 | Kataragama | 20,824 |
| 51 | Ambalangoda | 20,022 |
| 52 | Ampara | 18,237 |
| 53 | Kegalle | 17,851 |
| 54 | Hatton | 14,962 |
| 55 | Polonnaruwa | 13,789 |
| 56 | Kilinochchi | 12,895 |
| 57 | Tangalle | 10,386 |
| 58 | Monaragala | 10,125 |
| 59 | Wellawaya | 9,889 |
| 60 | Gampaha | 9,239 |
| 61 | Horana South | 8,871 |
| 62 | Wattegama | 7,889 |
| 63 | Minuwangoda | 7,661 |
| 64 | Horawala Junction | 7,389 |
| 65 | Kuliyapitiya | 6,766 |
Population Composition
Nearly 75 percent of the population is Sinhalese and about 18 percent are Tamils. In addition, there are about 7 percent Moors (a Muslim people group with Arab roots). Of the indigenous peoples, the Witnesses, there is only a very small number left.
Sri Lanka’s ethnic relations have been conflicting for some time. After independence, the contradictions between Sinhalese and Tamils increased, partly because the Sinhalese gained some advantages. The official language became Sinhalese, and Buddhism was adopted as the official state religion. This situation led to increased dissatisfaction among the Tamil minority and a Tamil radical movement called the Tamil Tigers (LTTE) grew and demanded an independent Tamil state. The conflict between Sinhalese and Tamils led to civil war in the period 1983-2009. In 2009, the government declared it had defeated LTTE.
Population Patterns
The country’s average population density is high, averaging 308.2 residents per km², but it varies from over 500 residents per km² in the humid southwest of the island to below 60 in some districts in the east. Around 30 percent of the population lives in cities, after a continuous relocation from rural to urban, especially to the capital. The largest cities are Colombo, Gampaha, Kandy and Galle.
Language
Official languages are Sinhalese and Tamil. Also, the indigenous people, the Vedas, speak a dialect of Sinhalese, but some words of unknown origin point to a lost language. About 74 percent of the population speak Sinhalese, well over 18 percent Tamil (in the north and east). The Tamil dialects in Sri Lanka are archaic and the writing language is closer than the dialects in Tamil Nadu in India. English is used in administration. It is estimated that ten percent of the population is fluent in English.
Religion
About 70 percent of Sri Lankan people (mainly Sinhalese) are Buddhists and belong to the theravada school, about 16 percent (substantially Tamils) are Hindus, about 7.5 percent are Christians (about three-quarters Catholic) and about 8 percent are Muslims.
Buddhism is perceived as a fundamental part of national Sinhalese culture. There are around 6,000 monasteries and 30,000 monks and novices. Some religious centers gather believers from all the island’s religions, for example, the pilgrimage to Mount Adam’s Peak where Buddha (or Adam, or Shiva) should have left his footprint in stone, and to the center of the ecstatic cult of the god Kataragama on the southeast coast.


