Norway Population
Norway is a rich country with a high standard of living. The country has a solid welfare system, and benefits from large revenues from the oil industry.
Key figures and facts
- Capital: Oslo
- Ethnic groups: Norwegians (including around 60,000 Sami) 83.2%, other Europeans 8.3%, others 8.5% (2017)
- Language: Norwegian, Sami
- Religion: Protestants 70.6%, Muslims 3.2%, Roman Catholic 3%, other Christians 3.7%, other/unspecified 19.5% (2016)
- Population: 5,353,363 (2018)
- Control Form: Constitutional monarchy
- Area: 385 178 km2
- Currency: Norwegian krone
- GNP per capita: 58 790 PPP $
- National Day: May 17th
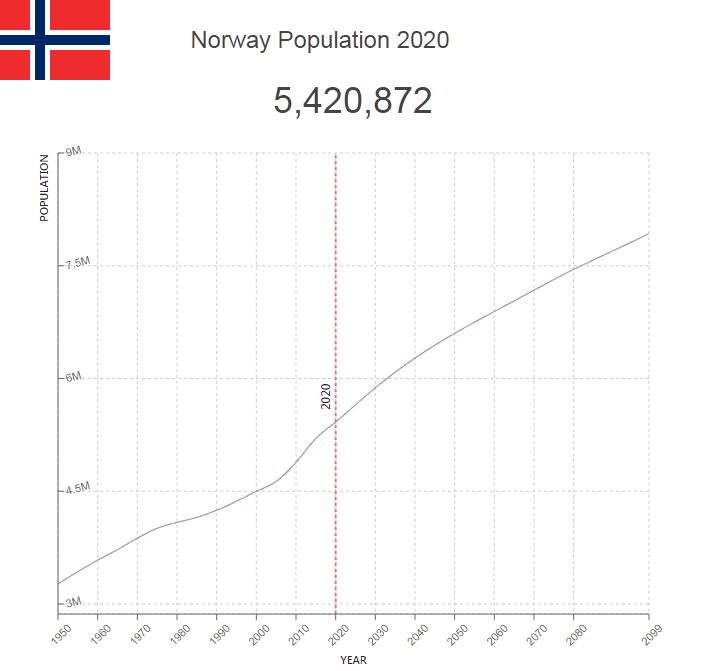
Population of Norway
Norway’s population passed three million in 1942, four million in 1975 and five million in 2012. At the start of 2020, Norway had a total of 5,367,580 residents including Svalbard and Jan Mayen. At the same time, 11.3 percent of the country’s population had foreign citizenship, while the immigrant population (immigrants and Norwegian-born with two immigrant parents) made up 18.2 percent.
The changes in the population is a result of the number of births (in turn dependent on birth rate), the number of deaths (a result of mortality), emigration and immigration. After the first half of the 1980s, when the percentage growth in the Norwegian population amounted to 0.3–0.4 percent annually, the growth later – with the exception of 1989 and 1990 – each year was between 0.5 and 1.3 percent. annual. In the period 1991-2005, annual growth in the population was between 0.5 and 0.7 percent. Growth then rose markedly to a peak in the three years 2010–2012 of 1.3 percent annually. Later, population growth has been lower, in the period 2013–2018 between 1.1 percent (in 2013 and 2014) and 0.6 percent (2018), and in 2019 the population in Norway increased by 0.7 percent.
The strong population growth after the turn of the century is largely due to increased net immigration from abroad, a result of unrest and conflicts in many places in the world, after 2010 especially in the Middle East. Nevertheless, the migration from abroad to Norway in relation to the country’s population is not higher today than, for example, the move from Norway to abroad in the latter half of the 19th century and the beginning of the 20th century, when the emigration to overseas countries – especially to the United States – was very large.
The total fertility rate, that is, the average number of children every woman resident in Norway receives during her life, was 1.53 in 2019 compared to 1.98 in 2009. In 2019, the average life expectancy at birth was 81.2 years for men and 84.7 years for women.
There is a big difference between the settlements in the different parts of the country. Most densely populated are the settlements in the central Eastland area, especially in the Oslo area and elsewhere around the Oslo Fjord, as well as around the largest cities and towns along the Westland coast, especially on Nord Jæren and around Bergen, as well as in the areas east and south of the Trondheim Fjord.
The Sami indigenous people have their largest population concentrations in the northern parts of the country, especially in Finnmark. Central and northern Norway constitute the Norwegian parts of Sápmi, the traditional Sami settlement area.
Population of Norway by Year (Historical)
| Year | Population | Annual Growth Rate | Population Density | Global Rank |
| 2020 | 5,421,130 | 0.790% | 14.8418 | 119 |
| 2019 | 5,378,746 | 0.770% | 14.7258 | 119 |
| 2018 | 5,337,851 | 0.790% | 14.6138 | 118 |
| 2017 | 5,296,215 | 0.860% | 14.4998 | 118 |
| 2016 | 5,250,838 | 0.980% | 14.3756 | 118 |
| 2015 | 5,199,725 | 1.250% | 14.2357 | 118 |
| 2010 | 4,885,767 | 1.070% | 13.3762 | 118 |
| 2005 | 4,632,253 | 0.580% | 12.6821 | 116 |
| 2000 | 4,499,256 | 0.600% | 12.3180 | 115 |
| 1995 | 4,366,884 | 0.560% | 11.9556 | 114 |
| 1990 | 4,247,174 | 0.450% | 11.6279 | 114 |
| 1985 | 4,152,994 | 0.330% | 11.3700 | 108 |
| 1980 | 4,085,965 | 0.390% | 11.1865 | 104 |
| 1975 | 4,007,920 | 0.670% | 10.9728 | 100 |
| 1970 | 3,875,949 | 0.800% | 10.6115 | 96 |
| 1965 | 3,724,352 | 0.780% | 10.1965 | 94 |
| 1960 | 3,582,396 | 0.870% | 9.8079 | 90 |
| 1955 | 3,430,229 | 0.990% | 9.3913 | 86 |
| 1950 | 3,265,162 | 0.000% | 8.9394 | 83 |
Major Cities in Norway by Population
| Rank | City | Population |
| 1 | Oslo | 579,889 |
| 2 | Bergen | 213,474 |
| 3 | Trondheim | 147,028 |
| 4 | Stavanger | 121,499 |
| 5 | Drammen | 90,611 |
| 6 | Fredrikstad | 72,649 |
| 7 | Kristiansand | 63,703 |
| 8 | Sandnes | 62,921 |
| 9 | Tromso | 52,325 |
| 10 | Sarpsborg | 52,048 |
| 11 | Skien | 50,484 |
| 12 | Alesund | 43,985 |
| 13 | Sandefjord | 42,543 |
| 14 | Haugesund | 40,210 |
| 15 | Tonsberg | 38,803 |
| 16 | Moss | 34,381 |
| 17 | Porsgrunn | 34,266 |
| 18 | Bodo | 33,962 |
| 19 | Arendal | 30,805 |
| 20 | Hamar | 29,368 |
| 21 | Ytrebygda | 23,933 |
| 22 | Larvik | 23,002 |
| 23 | Halden | 21,859 |
| 24 | Steinkjer | 19,889 |
| 25 | Harstad | 19,322 |
| 26 | Lillehammer | 18,985 |
| 27 | Molde | 18,483 |
| 28 | Mo i Rana | 17,742 |
| 29 | Kongsberg | 17,556 |
| 30 | Horten | 17,549 |
| 31 | Gjovik | 17,485 |
| 32 | Askoy | 17,113 |
| 33 | Kristiansund | 16,674 |
| 34 | Narvik | 14,003 |
| 35 | Lillestrom | 13,889 |
| 36 | Honefoss | 13,567 |
| 37 | Ski | 12,402 |
| 38 | Elverum | 12,379 |
| 39 | Askim | 12,371 |
| 40 | Jessheim | 12,254 |
| 41 | Alta | 11,966 |
| 42 | Stjordalshalsen | 11,305 |
| 43 | Drobak | 11,252 |
| 44 | Kongsvinger | 11,070 |
| 45 | Leirvik | 10,917 |
| 46 | Vennesla | 10,820 |
| 47 | Nesoddtangen | 10,800 |
| 48 | Mandal | 10,032 |
| 49 | Mosjoen | 9,525 |
| 50 | Grimstad | 9,450 |
| 51 | Egersund | 9,391 |
| 52 | Namsos | 8,924 |
| 53 | Sogne | 8,889 |
| 54 | Raholt | 8,482 |
| 55 | Forde | 8,399 |
| 56 | Brumunddal | 8,330 |
| 57 | Levanger | 8,300 |
| 58 | Notodden | 8,195 |
| 59 | Floro | 8,119 |
| 60 | Bryne | 7,895 |
| 61 | As | 7,850 |
| 62 | Saeveland | 7,625 |
| 63 | Verdal | 7,043 |
| 64 | Hammerfest | 6,677 |
| 65 | Sogndal | 6,589 |
| 66 | Kopervik | 6,396 |
| 67 | Fetsund | 6,330 |
| 68 | Malvik | 6,308 |
| 69 | Orsta | 6,226 |
| 70 | Holmestrand | 6,024 |
| 71 | Indre Arna | 6,006 |
| 72 | Lillesand | 5,970 |
| 73 | Raufoss | 5,941 |
| 74 | Fauske | 5,842 |
| 75 | Klofta | 5,831 |
| 76 | Tananger | 5,706 |
| 77 | Sandnessjoen | 5,667 |
| 78 | Hommersak | 5,581 |
| 79 | Flekkefjord | 5,504 |
| 80 | Stavern | 5,482 |
| 81 | Voss | 5,460 |
| 82 | Tranby | 5,441 |
| 83 | Jorpeland | 5,426 |
| 84 | Mysen | 5,405 |
| 85 | Volda | 5,265 |
| 86 | Odda | 5,248 |
| 87 | Vestby | 5,219 |
| 88 | Kragero | 5,047 |
| 89 | Vadso | 5,028 |
| 90 | Ulsteinvik | 4,992 |
| 91 | Akrehamn | 4,907 |
| 92 | Hermansverk | 1,889 |
The crowd by gender and age
The trend in population distribution by gender and age is well illustrated by population pyramids. An important change in the composition of the population in Norway over the last hundred years is the strong growth in the proportion of older people. This is partly due to demographic conditions; The age cohorts that “recruit” the age group 67 years and older over the years are thus to a considerable extent a reflection of previous birth figures. The increase in life expectancy has also had an impact on the growth in the proportion of older people in the population.
The proportion 67 years and older reached a provisional peak level in 1990 of 14.4 percent, and then decreased to 12.9 percent until 2009 as a result of the significantly reduced birth cohorts in the early 1920s and up to the mid-1930s.. Since then, the proportion has risen, to 14.0 percent in 2015 and and in 2020 was 15.4 percent.
Another important change in the population composition since 1900 is the decline in the proportion of children, but this is to a greater extent than for the elderly characterized by the periodic fluctuations in the wake of the changes in the birth rate. There was a particularly sharp reduction in the proportion of children from the 1920s to the 1940s and an increase in the proportion later as a result of the large post-war coals. This increase was replaced by a new decline in the proportion of children from around 1960 and about 25 years onwards when the country again received increased birth rates.
It is important to note, however, that the proportion of children, although it has risen in recent years, remains historically low in 2020, despite the fact that the number of children in absolute numbers is now large. Of Norway’s population, 37.3 percent were aged 0-15 in 1900; in 1943 this proportion had dropped to 23.1 percent. It rose until 1959 when it reached 27.7 percent, but then went back to 1992, when it was 20.3 percent. In 2020, the proportion of the country’s population aged 0-15 years was reduced to 18.5 percent.
The population’s distribution by gender, the so-called gender proportion, has also undergone major changes. By the first census in 1769, there were 1108 women per 1,000 men living in Norway. Since then, the figure has dropped:
| Year | Number of women per 1000 men |
| 1769 | 1108 |
| 1801 | 1089 |
| 1900 | 1064 |
| 1950 | 1017 |
| 1960 | 1007 |
| 1970 | 1010 |
| 1980 | 1017 |
| 1990 | 1023 |
| 2000 | 1020 |
| 2010 | 1002 |
| 2020 | 983 |
Historically, the decline in the number of women per 1000 men is mainly due to improved health conditions, which in particular has reduced mortality among boys and men.
After 1960, the women’s surplus showed an increase; it was in 1976 at 1014 and in 1995 at 1022. Since then, it has declined again, especially after 2005. In 2011, more men than women lived here in the country for the first time (999 women per 1000 men), and the subsequent figures the years show a continued decline in women’s share of the country’s population; in 2020, there were only 983 women per 1,000 men living in the country.
Behind this change lies, among other things, a reduced difference between the life expectancy of women and men, which has especially benefited boys/men. Net immigration to the country draws in a long-term perspective in the opposite direction; it gives a man surplus in the population. However, net immigration to the country varies greatly from year to year, and it also alternates between a male and a female surplus.
The relationship between the number of women and men shows great disparity between the individual age groups. More boys than girls are born; in Norway, for example, 1060 boys per 1000 girls (live births) were born in 2019. Due to a generally higher mortality rate among boys/men at most age levels, the excess of boys at birth is reduced with age. Up to the 1930s, the surplus of women entered everything by the age classes of about 20 years, but later the surplus appeared only at a higher age. In 1970, for example, there was a female surplus in the population from the age of 51, in 2000 it had risen to 60 years, and in 2020, the female surplus in the population was only at the age of 65.
The population by nationality and ethnic origin
Norway is traditionally inhabited by two people, Norwegians and Sami. Large parts of the Sami population’s traditional settlement area, Sápmi, lie on the Norwegian side of the state borders: parts of northern and central Norway as well as adjacent areas in the south. The Norwegian Sami population is divided into several different groups, including three different Sami languages. Southern Sami has its traditional area south of the Saltfjellet (Southern Sami), pitsams and Lule Sams traditionally live south of the Tysfjord (Lule Sami), and the northern Sami area extends north and east to Sør-Varanger (Northern Sami). At the border with Russia, the traditional area of the Eastern Sami begins. All indications are that Norway has the largest Sami population of the four countries that have parts of Sápmi within their borders (Norway, Sweden, Finland and Russia).
However, all data on the number of Sami in Norway is considered to be uncertain. Since 1930, there have been no attempts at nationwide census of the Sami population. The Sami election number is often incorrectly referred to as a ” Sami number”, but this is only a register of persons with the right and interest to vote in the Sami Parliament. Although secure data is lacking, research has been done based on the selection of Sami that gives a clue to the development of the Sami population. The Sami population is larger the further north you come to Norway, although many also live in urban centers further south in the country. Also within the traditional Sami settlement area, there is an increasing urbanization of the Sami population, to cities such as Alta, Tromsø, Bodø and Trondheim.
Five ethnic groups have the status of national minorities in Norway. The Kven or Norwegian Finns were the first large immigrant population in Norway. Representatives of this peoples were present in northern areas that today belong to Norway as early as the 16th century. However, it was not until the 18th and 19th centuries that Kven settled in greater numbers in areas under Norwegian rule. In the 16th century, the first of Norway’s Romani immigrants immigrated. At the end of the same century, the Finnish population settled in eastern Norway. The other two national minorities in Norway, Roma and Jews, first came to the country in greater numbers in the 19th century.
As with the Sami population, there are no official figures on how many other national minorities count. There are many in Finnmark and Troms who are of Kvenian descent, but you do not have certain figures on how many who count as Kven, and how many who can speak the language. While Sami and Kven were subjected to state assimilation policy for many years, people living in Romani communities were also subjected to sterilization. It is estimated that a few thousand people in today’s Norway are Romani. Norwegian Jews and Roma became victims of deportation to concentration camps during the Holocaust, and today there are few in Norway. The Mosaic Faith Society has over 800 members today, and it is estimated that there are a few hundred Norwegian rooms.
As of January 1, 2020, there were 604,516 people living in Norway with foreign nationality, which accounted for 11.3 percent of the country’s total population.
In comparison, in 2020, a total of 979,254 immigrants and Norwegian-born with two immigrant parents (the immigrant population) lived in the country, which corresponds to 18.2 percent of the country’s total population. In the same year, the immigrant population divided by 41 percent based on “western countries” (EU/EEA countries, Switzerland, the UK and the small countries with an economy linked to these countries in Europe, as well as Canada, USA, Australia and New Zealand) and 59 percent from the rest of the world.
Of the immigrant group from “western countries”, 7.8 percent had a background from one of the other Nordic countries, 31.7 percent from the other “western countries” in Europe and 1.5 percent from the USA, Canada, Australia and New Zealand. In 2020, 10.6 percent of the immigrant population in Norway also had a background from Europe, especially from the countries of the former Yugoslavia, Russia and Turkey.
By 2020, of the immigrant group from non-western countries, well over half were from an Asian country (31.5 out of a total of 59 percent from a “non-western country”). In comparison, the group from African countries and Eastern Europe outside the EU/EEA countries accounted for 14.0 and 10.6 percent of the immigrant population this year respectively. People from countries in America south of the United States made up 2.9 percent of immigrants living in Norway in 2020.
The single nation with the largest proportion of the immigrant population in Norway is Poland; in 2020, 115,416 people or 11.8 percent of the immigrant population had a Polish background. Then followed another nine countries with more than 25,000 residents in Norway this year; these are (percent of the total immigrant population 2020):
- Lithuania(4.8)
- Somalia(4.4)
- Sweden(4.0)
- Pakistan(3.9)
- Syria(3,7)
- Iraq(3,5)
- Eritrea(3.0)
- Germany(2.9)
- Philippines(2.7)
It is worth noting that immigrants from “non-western countries” are largely granted Norwegian citizenship after a few years. This is rarely the case for those with a western background; they largely want to retain their original citizenship.
There are large geographical differences between the counties with regard to the proportion of the population with immigrants or Norwegian-born where both parents are immigrants. The share is largest in the big cities, especially in Oslo, where the immigrant population in 2020 constituted 33.8 percent of the total population. The immigrant population distributed 23.5 percent this year on “non-western” and 10.3 percent on “western countries”. There is a clear tendency for the immigrant population to concentrate over time on the big cities, since many who initially settled around the country, after some time moving to the big cities, not least to Oslo. This is especially true of immigrants from “non-western countries”.
Also within the cities, there are large geographical differences in immigrant proportions in the population. The differences are particularly large when one distinguishes between immigrants with backgrounds from “western” and “non-western countries” respectively. In 2020, for example, 18.2 percent of residents in Bydel Nordstrand in Oslo were immigrants or Norwegian-born with two immigrant parents (4.6 percent with a western and 13.6 percent with a non-western background), compared with 56.7 percent of those living in the neighboring part of Søndre Nordstrand (52.3 percent with non-western and 4.4 percent with western background). The very high proportion of immigrants in Søndre Nordstrand is largely due to the fact that relatively many newly built homes were available here as the number of immigrants began to increase in earnest from about 1980 onwards.
There are also major geographical differences in where the immigrants from different nationalities have settled. In 2020, for example, a larger proportion of immigrants with a Pakistani background residing in Oslo (9.8 percent) than with Polish (7.0 percent), while in the country as a whole there is a far greater proportion of Polish (11.8 percent). percent) than Pakistani backgrounds (4.0 percent). The strong concentration of people with Pakistani backgrounds in Oslo is reflected in the fact that a total of 59 percent of all people in Norway with a Pakistani background in 2020 lived in Oslo. In contrast, the city’s share of the country’s residents is of Polish background, which was 14 percent this year.
There are clear differences between the largest cities in terms of the largest immigrant groups. While Pakistanis make up the largest group in Oslo, it is the Poles who are the largest group in both Drammen, Kristiansand Stavanger and Bergen; Largest group in Fredrikstad and Trondheim are the Iraqis, all based on 2020 figures.
Population by way of life
The economic and technological development has changed the occupational distribution of the population over the last 150 years. The most important element of this development is the transition from the primary industries (agriculture, forestry, fishing) to the secondary industries (mining and industry and construction and power and water supply/renovation) and later, especially after the 1960s, to tertiary – or service industries.
Employment in primary industries has been declining in absolute terms as well as in the proportion of the working population since the mid-1800s. The economic crisis in the 1920s and 1930s slowed down the transition from primary industries, but after World War II, the decline in employment in primary industries was particularly strong, and in 2019 only 2.2 percent of the country’s employment in these industries.
Industrialization led to significant growth in the industry’s share of the population from the latter part of the 19th century until the First World War. In the interwar period, industrial employment showed only weak growth and proportional stagnation. A new upswing in employment in the industry came from the late 1930s until the first half of the 1970s. The industry’s share of total employment increased to around 1950, since it remained relatively stable until about 1970. Thereafter, industry employment has steadily declined both in absolute terms and as a proportion of the country’s total employment.
In 2019, secondary industries accounted for a total of 19.8 percent of total employment in this country, with 10.0 percent on industry and mining, including oil extraction, and 9.8 percent on construction and power and water supply/renovation. In comparison, the secondary industry’s share was just over 37 percent in 1970, of which slightly more than 27 percent in industry and mining alone. At this time, employment in industry reached its highest level in this country.
The service industries have experienced both absolute and proportional growth in employment for more than a hundred years. Growth has been particularly marked after World War II, and these industries accounted for a total of 78.0 percent of the country’s total employment in 2019. The largest group in the service industries is public administration/defense and education, health and social services, which had 35.5 of it. total employment in the country in 2019.
The largest employment among the other service industries is the retail trade/repair of vehicles and the hospitality and catering business with a total of 16.6 percent and finance and insurance and business services with a total of 16.8 percent of the total employment. The other employment in the service industries is found in the transport and storage and personal services sector, with 5.1 and 4.0 percent of total employment 2019 respectively.
From 1875 to 1990, the proportion of the population over 15 years of occupation showed an almost continuous decline, from 62 percent in 1880 to 43 percent in 1990. This is related to several factors, including larger sections of the population undergoing education, introduction and improvements in public social security benefits, such as the age and disability benefits and a largely increasing proportion of the elderly.
The decline in the labor force’s share of the population up to the mid-1960s is also partly due to the increased marriage rate during this period; Married women had significantly lower occupational participation at this time than unmarried women.
From the 1960s there has been a clear increase in the proportion of the working population over the age of 15, not least as a result of the strong increase in the participation rate for married women. Thus, the proportion of women among employed persons increased from 23 percent in the period 1960–2019 to slightly over 47 percent. This increase represents perhaps the most important change in the labor market in Norway in the latter half of the 20th century and has contributed significantly to the increase in the working population’s share of the resident population over 15 years since the 1960s.


