Moldova Population

Moldova became independent after the fall of the Soviet Union in 1991, and is today one of the poorest countries in Europe. The country has a common cultural heritage with Romania, and their languages are almost identical.
Key figures and facts
- Capital: Chisinau
- Ethnic groups: Moldovans 75.8%, Ukrainians 8.4%, Russians 5.9%, Gagusians 4.4%, Romanians 2.2%, Bulgarians 1.9%, others 1.4% (2004) Note: internal conflict with ethnic slaves in the Transnistria region.
- Language: Moldovan (official, very similar to Romanian), Romanian, Russian, Ukrainian, Gagausian (a Turkish dialect) and others.
- Religion: Orthodox Christians 93.3%, Baptists 1%, Other Christians 1.2% (2004)
- Control Form: Republic
- Area: 33 850 km²
- Currency: Moldovan Leu
- GNP per capita: 5 332 PPP $
- National Day: August 27th
Moldova’s Population
When Moldova was one of the republics of the Soviet Union (until 1991), the population grew significantly, especially in the 1960s. Immigration from other parts of the Soviet Union was a major reason. In 1989, the country had 4.3 million residents. The population has since declined somewhat (2018: 3.5 million). Poverty has led many to leave the country to seek employment elsewhere. But there are also many who move to the country. Most of them are former emigrants who return. In total, there is an annual net emigration of approximately 50 000. The age composition of the population has been changing for several years. The older year classes make up an increasing proportion, while there are fewer in the younger year classes.
Life expectancy for newborns was 77.1 years for women in 2018 and 69.1 years for men. The infant mortality rate in 2018 was 10.0 per thousand (10 children per 1000 live births died before the age of one year). In 1980, the corresponding figure was 35.0 and in 1990 it was 19.0.
Population of Moldova by Year (Historical)
| Year | Population | Annual Growth Rate | Population Density | Global Rank |
| 2020 | 4,033,852 | -0.230% | 122.7995 | 131 |
| 2019 | 4,043,152 | -0.210% | 123.0826 | 131 |
| 2018 | 4,051,833 | -0.190% | 123.3469 | 131 |
| 2017 | 4,059,573 | -0.160% | 123.5825 | 130 |
| 2016 | 4,065,898 | -0.110% | 123.7750 | 129 |
| 2015 | 4,070,589 | -0.080% | 123.9178 | 128 |
| 2010 | 4,085,970 | -0.360% | 124.3860 | 126 |
| 2005 | 4,159,182 | -0.210% | 126.6147 | 122 |
| 2000 | 4,202,547 | -0.640% | 127.9348 | 118 |
| 1995 | 4,340,486 | -0.110% | 132.1338 | 115 |
| 1990 | 4,365,453 | 0.700% | 132.8939 | 111 |
| 1985 | 4,216,138 | 1.000% | 128.3485 | 107 |
| 1980 | 4,010,965 | 0.880% | 122.1028 | 105 |
| 1975 | 3,839,934 | 1.320% | 116.8963 | 104 |
| 1970 | 3,595,444 | 1.510% | 109.4537 | 102 |
| 1965 | 3,336,481 | 2.120% | 101.5705 | 99 |
| 1960 | 3,004,341 | 2.720% | 91.4597 | 99 |
| 1955 | 2,626,901 | 2.330% | 79.9699 | 101 |
| 1950 | 2,340,886 | 0.000% | 71.2632 | 101 |
Major Cities in Moldova by Population
| Rank | City | Population |
| 1 | Chisinau | 635,883 |
| 2 | Tiraspol | 156,889 |
| 3 | Balti | 124,889 |
| 4 | Bender | 110,064 |
| 5 | Ribnita | 55,344 |
| 6 | Cahul | 34,381 |
| 7 | Ungheni | 34,311 |
| 8 | Soroca | 27,312 |
| 9 | Orhei | 24,807 |
| 10 | Dubasari | 23,143 |
| 11 | Comrat | 22,800 |
| 12 | Edinet | 22,761 |
| 13 | Ceadir-Lunga | 22,589 |
| 14 | Causeni | 21,579 |
| 15 | Straseni | 19,114 |
| 16 | Hincesti | 16,789 |
| 17 | Floresti | 16,648 |
| 18 | Drochia | 15,969 |
| 19 | Bilicenii Vechi | 15,368 |
| 20 | Slobozia | 15,245 |
| 21 | Ialoveni | 14,804 |
| 22 | Singerei | 14,489 |
| 23 | Falesti | 14,266 |
| 24 | Vulcanesti | 14,241 |
| 25 | Leova | 14,190 |
| 26 | Briceni | 14,021 |
| 27 | Calarasi | 13,955 |
| 28 | Taraclia | 13,401 |
| 29 | Riscani | 12,782 |
| 30 | Cimislia | 12,353 |
| 31 | Nisporeni | 11,607 |
| 32 | Camenca | 10,961 |
| 33 | Basarabeasca | 10,698 |
| 34 | Dnestrovsc | 10,315 |
| 35 | Glodeni | 10,035 |
| 36 | Dancu | 9,889 |
| 37 | Briceni | 9,789 |
| 38 | Rezina | 9,695 |
| 39 | Hryhoriopol | 9,345 |
| 40 | Donduseni | 9,324 |
| 41 | Ocnita | 9,214 |
| 42 | Mindresti | 9,169 |
| 43 | Chitcani | 8,889 |
| 44 | Otaci | 8,289 |
| 45 | Anenii Noi | 8,139 |
| 46 | Stefan Voda | 7,589 |
| 47 | Cricova | 7,289 |
| 48 | Pervomaisc | 7,189 |
| 49 | Singera | 7,089 |
| 50 | Criuleni | 6,821 |
| 51 | Ciorescu | 6,759 |
| 52 | Telenesti | 6,522 |
| 53 | Soldanesti | 6,049 |
| 54 | Tvardita | 5,689 |
| 55 | Stauceni | 5,589 |
| 56 | Iargara | 5,489 |
| 57 | Vadul lui Voda | 5,189 |
| 58 | Cocieri | 4,040 |
| 59 | Cantemir | 3,718 |
Population Groups
At the 2014 census, 75 percent of the population declared themselves Moldovans and 7 percent as Romanians. Other population groups are Ukrainians (6.6 percent), Russians (4.1 percent), Gagusians (4.6 percent), Bulgarians (1.9 percent).
As it can often be unclear what is meant by moldover as an ethnic group name, it is also of interest to include what people answer to questions about mother tongue and everyday language. Since Moldovan and Romanian are the same language (the two names are due to political conditions, not linguistic), Romanian is used here as a common term. Then, in 2014, 80.2 stated Romanian as their mother tongue, while 78.6 had it as a daily language. Russian was the mother tongue for 9.7 percent and the native language for 14.5 percent. Corresponding figures for Ukrainian were 3.9 and 2.7 percent, for Gagusian 4.2 and 2.7 percent, Bulgarian 1.5 and 1.0 percent.
Cities
43 percent of the population lives in cities. Next to the capital Chişinău are the main cities of Bălţi, Tiraspol (in Transnistria, outside the control of the central government), Bender (also called Tighina, in Transnistria), Rîbniţa (Transnistria), Cahul, Ungheni, Soroca, Orhei.
The Russians and the Ukrainians are over-represented in the largest cities in proportion to their share of the total population. In Chișinău, in 2014 there were 37.7 percent of Russians and 14.9 percent of Ukrainians, thus more than half of the population (52.6 percent) in the country’s capital belonged to these two Slavic peoples, against 10.7 percent in the entire country. In the 19th century, the cities were dominated by Russians and Jews.
Today, there are few Jews in Moldova. After World War II, Soviet industrialization led many Russians and Ukrainians to immigrate to the cities of Moldova. The Moldovan population was subject to a strong linguistic Russification pressure under the Moscow regime, including through the education system.
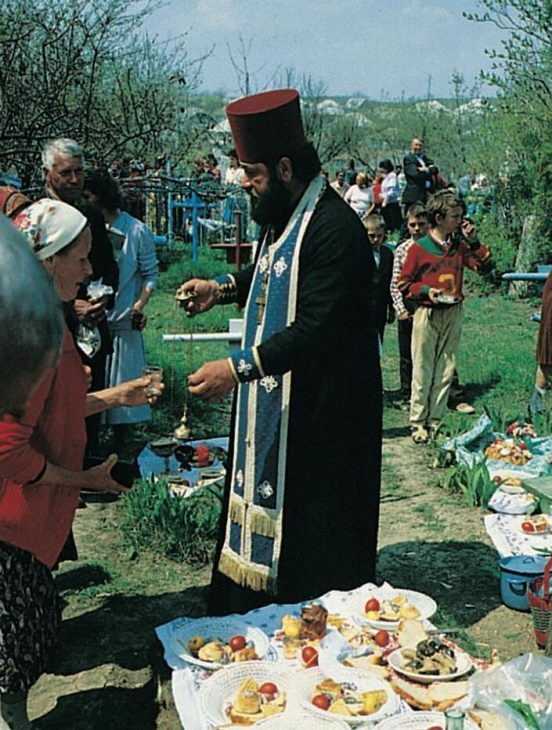
Religion
In Moldova, Orthodox Christianity dominates. The Orthodox Church is divided into two. The largest is subject to the Moscow Patriarchate. The smallest is associated with the București Patriarchate. At the census in 2014, 97 percent stated that they considered themselves Orthodox. 1 percent stated that they were Baptists. While in Soviet times it was approximately In 2014, 50 percent considered themselves “non-religious,” only 0.2 percent called themselves atheists or agnostics. 7 percent did not answer the question of religion.


