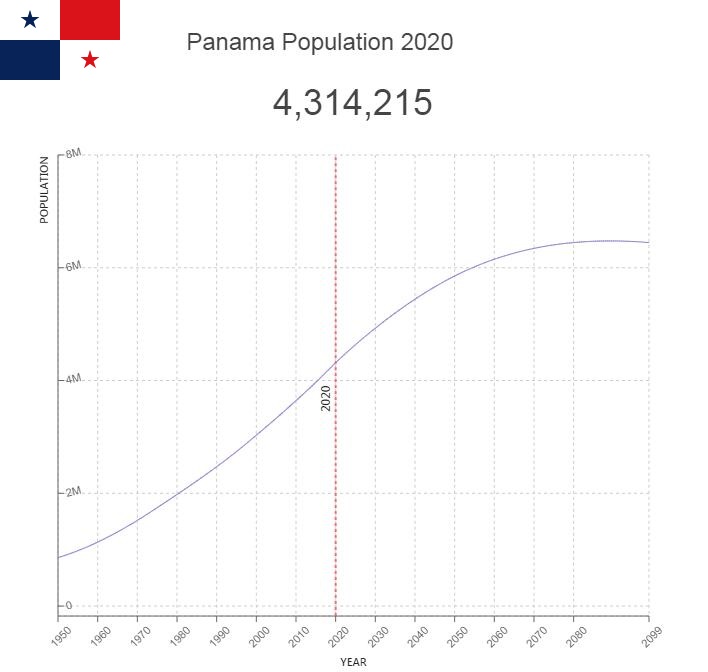
Panama Population
Panama is located midway between North and South America. The country is best known for the Panama Canal, which allows ships to sail between the Pacific and Atlantic in less than one day.
Key figures and facts
- Capital: Panama City
- Ethnic groups: Fertilizers (mix of Europeans and Indigenous people) 65%, Indigenous people 12.3% (Ngabe 7.6%, Kuna 2.4%, Embera 0.9%, Bugle 0.8%, other 0.4%, unspecified 0, 2%), African Origin 9.2% Blend of African and European Origin 6.8%, European Origin 6.7% (2010)
- Language: Spanish (official), Origin, Panama English Creole, English, Chinese (Yue and Hakka), Arabic, French Creole, Other (Yiddish, Hebrew, Korean and Korean)
- Religion: Catholics 85%, Protestants 15%
- Population: 4,162,618 (2018)
- Control Form: Parliamentary democracy
- Area: 75 420 km2
- Currency: Panamanian balboa
- GNP per capita: 23 009 PPP $
- National Day: November 3rd
Population of Panama
The population of Panama was estimated at 3,864,000 (World Bank) in 2013. Annual population growth of 1.6%. Life expectancy for women is 80.3 years and for men 74.6 years.

Most of present-day Panama, before the colonization of the Spaniards, was divided into small chieftainships. The Cuna Indians, who in the 16th century spoke about 700,000, were the most powerful. Nearly 48,000 cuna were recorded in the 1990 census, which today lives in the province of San Blas, where they have enjoyed a significant degree of autonomy since 1925. In the province of Chiriquí in the west lives the Guayami people, which counts approximately 175,000, and in the Darién jungle the choco people, which count approximately 15,000 in Panama. Teribe, in the province of Bocas del Toro, counts approximately In total, the Native American population is approximately 300,000, or about 5% of the country’s total population, which is otherwise very composed. European/Native or European/African origin mix approximately 70%, white 12% and black 12%. Chinese and Indian origin. However, these categories are far from clearly defined.
The settlement is mainly found on the Pacific side. Otherwise, urbanization has been great, and in 2013, 76% of the population lived in the city. The influx of some of the cities is large and has led to population pressure and social problems. The largest city is the capital Ciudad de Panamá.
Population of Panama by Year (Historical)
| Year | Population | Annual Growth Rate | Population Density | Global Rank |
| 2020 | 4,314,656 | 1.610% | 58.0410 | 128 |
| 2019 | 4,246,328 | 1.670% | 57.1219 | 128 |
| 2018 | 4,176,758 | 1.710% | 56.1860 | 128 |
| 2017 | 4,106,658 | 1.730% | 55.2431 | 129 |
| 2016 | 4,036,967 | 1.730% | 54.3056 | 130 |
| 2015 | 3,968,376 | 1.730% | 53.3829 | 131 |
| 2010 | 3,642,576 | 1.810% | 49.0004 | 130 |
| 2005 | 3,330,106 | 1.910% | 44.7971 | 131 |
| 2000 | 3,030,217 | 2.040% | 40.7631 | 134 |
| 1995 | 2,739,557 | 2.090% | 36.8532 | 131 |
| 1990 | 2,470,836 | 2.170% | 33.2385 | 132 |
| 1985 | 2,219,090 | 2.320% | 29.8520 | 133 |
| 1980 | 1,978,376 | 2.540% | 26.6140 | 133 |
| 1975 | 1,745,027 | 2.810% | 23.4751 | 134 |
| 1970 | 1,519,174 | 2.940% | 20.4370 | 135 |
| 1965 | 1,314,566 | 3.020% | 17.6847 | 134 |
| 1960 | 1,132,886 | 2.920% | 15.2408 | 135 |
| 1955 | 980,969 | 2.680% | 13.1972 | 137 |
| 1950 | 859,548 | 0.000% | 11.5639 | 137 |
Major Cities in Panama by Population
| Rank | City | Population |
| 1 | Panama City | 408,057 |
| 2 | San Miguelito | 321,390 |
| 3 | Juan Diaz | 100,525 |
| 4 | David | 81,846 |
| 5 | Arraijan | 76,704 |
| 6 | Colon | 76,532 |
| 7 | Las Cumbres | 68,991 |
| 8 | La Chorrera | 61,121 |
| 9 | Pedregal | 51,530 |
| 10 | Tocumen | 50,733 |
| 11 | Santiago de Veraguas | 45,244 |
| 12 | Parque Lefevre | 36,886 |
| 13 | Chilibre | 33,425 |
| 14 | Cativa | 29,496 |
| 15 | Rio Abajo | 26,496 |
| 16 | Nuevo Belen | 23,945 |
| 17 | Ancon | 20,595 |
| 18 | Alcalde Diaz | 20,174 |
| 19 | El Chorrillo | 18,191 |
| 20 | Changuinola | 17,886 |
| 21 | La Cabima | 17,864 |
| 22 | La Concepcion | 17,587 |
| 23 | Pedregal | 17,316 |
| 24 | Veracruz | 17,033 |
| 25 | Curundu | 16,250 |
| 26 | Penonome | 16,139 |
| 27 | Sabanitas | 15,466 |
| 28 | Nuevo Arraijan | 14,809 |
| 29 | Villa Unida | 14,743 |
| 30 | San Vicente | 13,998 |
| 31 | Chepo | 12,801 |
| 32 | Puerto Escondido | 12,260 |
| 33 | Pocri | 12,193 |
| 34 | El Coco | 11,824 |
| 35 | San Juan Bautista | 11,687 |
| 36 | Puerto Armuelles | 11,632 |
| 37 | Las Lomas | 11,615 |
| 38 | El Empalme | 10,924 |
| 39 | Monagrillo | 10,710 |
| 40 | Volcan | 10,175 |
| 41 | Llano Bonito | 9,605 |
| 42 | Union Choco | 9,386 |
| 43 | Nueva Esperanza | 9,231 |
| 44 | Chitre | 8,858 |
| 45 | Las Tablas | 8,828 |
| 46 | Puerto Pilon | 8,643 |
| 47 | Almirante | 8,633 |
| 48 | Vista Alegre | 8,562 |
| 49 | Aguadulce | 8,390 |
| 50 | Altos de San Francisco | 8,078 |
| 51 | Canto del Llano | 7,743 |
| 52 | Gonzalillo | 7,682 |
| 53 | La Pesa | 7,662 |
| 54 | Sona | 7,558 |
| 55 | La Arena | 7,064 |
| 56 | Pacora | 6,745 |
| 57 | Anton | 6,740 |
| 58 | Guadalupe | 6,450 |
| 59 | La Herradura | 6,160 |
| 60 | Boquete | 6,012 |
| 61 | San Pablo Viejo Abajo | 5,881 |
| 62 | Los Santos | 5,859 |
| 63 | La Mitra | 5,588 |
| 64 | Rio Hato | 5,504 |
| 65 | Nata | 5,359 |
| 66 | Bocas del Toro | 5,269 |
| 67 | La Palma | 1,617 |
Religion
About 85% of the population are Catholics, approximately 6% Protestants and 5% Muslims. The church is separated from the state, and clergy cannot hold public office.
Language
Spanish is the official language; English is also widely used. In parts of the country, Native American languages are spoken. chibcha and choco languages.


