France Population
France is one of Europe’s largest and richest countries, and plays an important role in the European Union. The country has a very high standard of living, but has struggled financially since the early 2010’s.
Key figures and facts
- Capital: Paris
- Ethnic groups: Celts and Latinos with Teutonic, Slavic, North African, Indochinese and Basque minorities
- Language: French (official) 100%, regional dialects
- Religion: Christians (mainly Catholics) 63-66%, Muslims 7-9%, Buddhists 1%, Jews 1%, others 1% none 23-28% (2015)
- Population: 65 233 271 (2018)
- Control Form: Republic
- Area: 549 091 km²
- Currency: euro
- GNP per capita: 41 343 PPP $
- National Day: July 14th
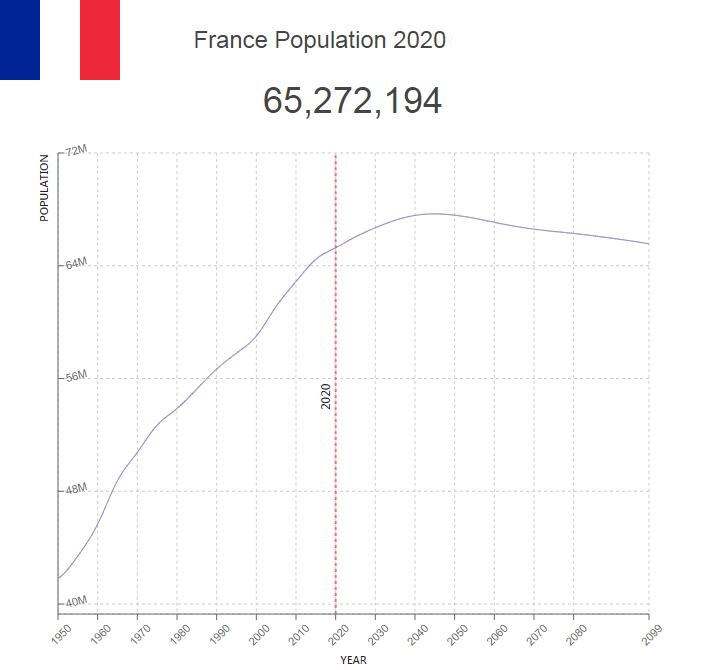
Population of France
The population of France is at 66 892 205 (2016). France has a very complex population, with large ethnic minorities. The country has been characterized by greater immigration than most neighboring countries, including from former French colonies, not least from North Africa.

The vast majority live in cities, not least in the most industrial parts of the country. About 20 percent of the population lives in and around Paris. Several of the largest French cities have suburbs characterized by de-industrialization and poverty, which is a major source of social unrest.
Life expectancy is 85.3 years for women and 78.9 years for men (2018).
Population of France by Year (Historical)
| Year | Population | Annual Growth Rate | Population Density | Global Rank |
| 2020 | 65,273,400 | 0.220% | 119.2086 | 22 |
| 2019 | 65,129,617 | 0.210% | 118.9460 | 22 |
| 2018 | 64,990,400 | 0.230% | 118.6918 | 22 |
| 2017 | 64,842,398 | 0.270% | 118.4215 | 22 |
| 2016 | 64,667,485 | 0.330% | 118.1020 | 22 |
| 2015 | 64,453,089 | 0.500% | 117.7105 | 22 |
| 2010 | 62,879,419 | 0.570% | 114.8365 | 22 |
| 2005 | 61,120,016 | 0.700% | 111.6233 | 20 |
| 2000 | 59,014,985 | 0.420% | 107.7789 | 20 |
| 1995 | 57,801,781 | 0.400% | 105.5632 | 20 |
| 1990 | 56,666,738 | 0.510% | 103.4903 | 17 |
| 1985 | 55,254,737 | 0.510% | 100.9116 | 16 |
| 1980 | 53,867,898 | 0.440% | 98.3788 | 16 |
| 1975 | 52,688,465 | 0.750% | 96.2248 | 15 |
| 1970 | 50,763,809 | 0.810% | 92.7098 | 15 |
| 1965 | 48,746,541 | 1.310% | 89.0257 | 14 |
| 1960 | 45,673,035 | 1.020% | 83.4126 | 12 |
| 1955 | 43,411,256 | 0.740% | 79.2819 | 11 |
| 1950 | 41,833,771 | 0.000% | 76.4010 | 11 |
Major Cities in France by Population
| Rank | City | Population |
| 1 | Paris | 2,138,440 |
| 2 | Marseille | 794,700 |
| 3 | Lyon | 472,206 |
| 4 | Toulouse | 432,944 |
| 5 | Nice | 338,509 |
| 6 | Nantes | 277,158 |
| 7 | Strasbourg | 274,734 |
| 8 | Montpellier | 248,141 |
| 9 | Bordeaux | 231,733 |
| 10 | Lille | 228,217 |
| 11 | Rennes | 209,264 |
| 12 | Reims | 196,454 |
| 13 | Le Havre | 185,861 |
| 14 | Cergy-Pontoise | 183,319 |
| 15 | Saint-Etienne | 176,169 |
| 16 | Toulon | 168,590 |
| 17 | Angers | 168,168 |
| 18 | Grenoble | 158,441 |
| 19 | Dijon | 149,671 |
| 20 | Nimes | 148,125 |
| 21 | Aix-en-Provence | 146,710 |
| 22 | Saint-Quentin-en-Yvelines | 146,487 |
| 23 | Brest | 144,788 |
| 24 | Le Mans | 144,404 |
| 25 | Amiens | 142,975 |
| 26 | Tours | 141,510 |
| 27 | Limoges | 141,065 |
| 28 | Clermont-Ferrand | 138,570 |
| 29 | Villeurbanne | 131,334 |
| 30 | Besancon | 128,315 |
| 31 | Orleans | 124,038 |
| 32 | Metz | 123,803 |
| 33 | Rouen | 112,676 |
| 34 | Mulhouse | 111,319 |
| 35 | Perpignan | 110,595 |
| 36 | Caen | 110,513 |
| 37 | Boulogne-Billancourt | 108,671 |
| 38 | Nancy | 105,223 |
| 39 | Argenteuil | 101,364 |
| 40 | Saint-Denis | 96,017 |
| 41 | Roubaix | 95,610 |
| 42 | Tourcoing | 91,463 |
| 43 | Montreuil | 90,541 |
| 44 | Avignon | 89,658 |
| 45 | Marseille 13 | 89,205 |
| 46 | Asnieres-sur-Seine | 86,631 |
| 47 | Nanterre | 86,608 |
| 48 | Poitiers | 85,849 |
| 49 | Versailles | 85,305 |
| 50 | Courbevoie | 85,047 |
| 51 | Creteil | 84,722 |
| 52 | Pau | 82,586 |
| 53 | Colombes | 82,189 |
| 54 | Vitry-sur-Seine | 80,890 |
| 55 | Aulnay-sous-Bois | 80,504 |
| 56 | Marseille 08 | 78,726 |
| 57 | Marseille 15 | 77,659 |
| 58 | Marseille 09 | 76,757 |
| 59 | La Rochelle | 76,699 |
| 60 | Champigny-sur-Marne | 76,615 |
| 61 | Rueil-Malmaison | 76,505 |
| 62 | Antibes | 76,282 |
| 63 | Saint-Maur-des-Fosses | 75,291 |
| 64 | Calais | 74,322 |
| 65 | Beziers | 73,970 |
| 66 | Dunkerque | 71,176 |
| 67 | Aubervilliers | 70,803 |
| 68 | Cannes | 69,900 |
| 69 | Merignac | 69,680 |
| 70 | Bourges | 67,876 |
| 71 | Saint-Nazaire | 66,943 |
| 72 | Colmar | 65,294 |
| 73 | Valence | 63,753 |
| 74 | Quimper | 63,738 |
| 75 | Drancy | 62,377 |
| 76 | Noisy-le-Grand | 62,309 |
| 77 | Villeneuve-d’Ascq | 62,289 |
| 78 | La Seyne-sur-Mer | 62,219 |
| 79 | Levallois-Perret | 62,067 |
| 80 | Marseille 14 | 61,809 |
| 81 | Chambery | 61,529 |
| 82 | Issy-les-Moulineaux | 61,336 |
| 83 | Neuilly-sur-Seine | 61,189 |
| 84 | Troyes | 60,674 |
| 85 | Antony | 59,734 |
| 86 | La Roche-sur-Yon | 59,299 |
| 87 | Marseille 12 | 58,623 |
| 88 | Lorient | 58,001 |
| 89 | Sarcelles | 57,868 |
| 90 | Pessac | 57,833 |
| 91 | Ivry-sur-Seine | 57,786 |
| 92 | Evreux | 57,684 |
| 93 | Venissieux | 57,473 |
| 94 | Cergy | 57,465 |
| 95 | Clichy | 57,356 |
| 96 | Marseille 11 | 56,681 |
| 97 | Saint-Quentin | 55,296 |
| 98 | Niort | 54,549 |
| 99 | Belfort | 54,451 |
| 100 | Ajaccio | 54,253 |
| 101 | Vannes | 53,909 |
| 102 | Sartrouville | 53,869 |
| 103 | Maisons-Alfort | 53,853 |
| 104 | Meaux | 53,700 |
| 105 | Blois | 53,549 |
| 106 | Brive-la-Gaillarde | 53,355 |
| 107 | Arles | 53,320 |
| 108 | Beauvais | 53,282 |
| 109 | Chateauroux | 53,190 |
| 110 | Cholet | 53,049 |
| 111 | Frejus | 52,987 |
| 112 | Pantin | 52,811 |
| 113 | Saint-Brieuc | 52,663 |
| 114 | Montauban | 52,323 |
| 115 | Charleville-Mezieres | 52,304 |
| 116 | Albi | 52,298 |
| 117 | Tarbes | 51,995 |
| 118 | Fontenay-sous-Bois | 51,964 |
| 119 | Evry | 51,789 |
| 120 | Clamart | 51,289 |
| 121 | Marseille 10 | 51,188 |
| 122 | Chalons-en-Champagne | 51,146 |
| 123 | Narbonne | 50,665 |
| 124 | Saint-Malo | 50,565 |
| 125 | Laval | 50,378 |
| 126 | Hyeres | 50,376 |
| 127 | Carcassonne | 49,489 |
| 128 | Angouleme | 49,357 |
| 129 | Annecy | 49,121 |
| 130 | Bondy | 48,157 |
| 131 | Le Blanc-Mesnil | 47,966 |
| 132 | Villejuif | 47,937 |
| 133 | Grasse | 47,470 |
| 134 | Sevran | 47,223 |
| 135 | Castres | 47,164 |
| 136 | Chalon-sur-Saone | 47,140 |
| 137 | Marseille 04 | 47,082 |
| 138 | Arras | 46,941 |
| 139 | Boulogne-sur-Mer | 46,902 |
| 140 | Chelles | 46,836 |
| 141 | Cagnes-sur-Mer | 46,812 |
| 142 | Saint-Herblain | 46,787 |
| 143 | Douai | 46,420 |
| 144 | Epinay-sur-Seine | 46,034 |
| 145 | Vincennes | 45,812 |
| 146 | Martigues | 45,638 |
| 147 | Marseille 03 | 45,303 |
| 148 | Bourg-en-Bresse | 45,229 |
| 149 | Bobigny | 44,851 |
| 150 | Montlucon | 44,849 |
| 151 | Aubagne | 44,733 |
| 152 | Valenciennes | 44,710 |
| 153 | Suresnes | 44,586 |
| 154 | Meudon | 44,541 |
| 155 | Marseille 05 | 44,472 |
| 156 | Bayonne | 44,285 |
| 157 | Istres | 44,262 |
| 158 | Thionville | 44,200 |
| 159 | Mantes-la-Jolie | 44,152 |
| 160 | Compiegne | 44,132 |
| 161 | Nevers | 43,877 |
| 162 | Chartres | 43,727 |
| 163 | Marseille 06 | 43,249 |
| 164 | Le Cannet | 43,242 |
| 165 | Wattrelos | 42,715 |
| 166 | Caluire-et-Cuire | 42,652 |
| 167 | Gap | 42,604 |
| 168 | Talence | 42,468 |
| 169 | Ales | 42,299 |
| 170 | Gennevilliers | 42,183 |
| 171 | Saint-Priest | 41,530 |
| 172 | Rosny-sous-Bois | 41,516 |
| 173 | Auxerre | 41,405 |
| 174 | Salon-de-Provence | 41,286 |
| 175 | Saint-Germain-en-Laye | 41,031 |
| 176 | Bastia | 40,890 |
| 177 | Marseille 01 | 40,808 |
| 178 | Sete | 40,625 |
| 179 | Anglet | 40,547 |
| 180 | Puteaux | 40,535 |
| 181 | Corbeil-Essonnes | 40,416 |
| 182 | Garges-les-Gonesse | 39,736 |
| 183 | Roanne | 39,729 |
| 184 | Savigny-sur-Orge | 39,587 |
| 185 | Epinal | 39,407 |
| 186 | Livry-Gargan | 39,407 |
| 187 | Saint-Ouen | 39,242 |
| 188 | Reze | 39,137 |
| 189 | Montigny-le-Bretonneux | 38,952 |
| 190 | Noisy-le-Sec | 38,844 |
| 191 | Melun | 38,842 |
| 192 | Bagneux | 38,789 |
| 193 | Massy | 38,657 |
| 194 | Haguenau | 38,610 |
| 195 | Montrouge | 38,597 |
| 196 | Marcq-en-Baroeul | 38,518 |
| 197 | Vitrolles | 38,480 |
| 198 | Draguignan | 38,462 |
| 199 | Lens | 38,154 |
| 200 | Gagny | 38,023 |
| 201 | Saint-Chamond | 37,903 |
| 202 | Bron | 37,714 |
| 203 | Vaulx-en-Velin | 37,378 |
| 204 | Joue-les-Tours | 37,355 |
| 205 | Alfortville | 37,179 |
| 206 | La Courneuve | 37,176 |
| 207 | Chatellerault | 37,099 |
| 208 | Villepinte | 37,003 |
| 209 | Cambrai | 36,381 |
| 210 | Poissy | 36,320 |
| 211 | Conflans-Sainte-Honorine | 36,247 |
| 212 | Mont-de-Marsan | 36,094 |
| 213 | Plaisir | 36,010 |
| 214 | Marseille 07 | 35,870 |
| 215 | Marignane | 35,762 |
| 216 | Dieppe | 35,596 |
| 217 | Montelimar | 35,526 |
| 218 | Tremblay-en-France | 35,480 |
| 219 | Choisy-le-Roi | 35,479 |
| 220 | Saint-Martin-d’Heres | 35,417 |
| 221 | Macon | 35,373 |
| 222 | Romans-sur-Isere | 34,891 |
| 223 | Saint-Raphael | 34,807 |
| 224 | Pontault-Combault | 34,687 |
| 225 | Six-Fours-les-Plages | 34,668 |
| 226 | Perigueux | 34,659 |
| 227 | Aurillac | 34,613 |
| 228 | Neuilly-sur-Marne | 34,354 |
| 229 | Lievin | 34,259 |
| 230 | Agen | 34,256 |
| 231 | Franconville | 34,173 |
| 232 | Sainte-Genevieve-des-Bois | 33,578 |
| 233 | Maubeuge | 33,573 |
| 234 | Bagnolet | 33,393 |
| 235 | Saumur | 33,118 |
| 236 | Biarritz | 33,077 |
| 237 | La Ciotat | 33,002 |
| 238 | Echirolles | 32,977 |
| 239 | Villefranche-sur-Saone | 32,883 |
| 240 | Chatenay-Malabry | 32,604 |
| 241 | Stains | 32,490 |
| 242 | Chatillon | 32,272 |
| 243 | Vienne | 32,182 |
| 244 | Schiltigheim | 32,178 |
| 245 | Les Mureaux | 32,023 |
| 246 | Le Perreux-sur-Marne | 31,904 |
| 247 | Guyancourt | 31,878 |
| 248 | Palaiseau | 31,876 |
| 249 | Saint-Dizier | 31,807 |
| 250 | Creil | 31,752 |
| 251 | Vandoeuvre-les-Nancy | 31,674 |
| 252 | Thonon-les-Bains | 31,573 |
| 253 | Bethune | 31,457 |
| 254 | Colomiers | 31,252 |
| 255 | Nogent-sur-Marne | 31,125 |
| 256 | Athis-Mons | 31,114 |
| 257 | Viry-Chatillon | 31,020 |
| 258 | Houilles | 31,010 |
| 259 | Soissons | 30,989 |
| 260 | Dreux | 30,947 |
| 261 | Charenton-le-Pont | 30,799 |
| 262 | Villeneuve-Saint-Georges | 30,770 |
| 263 | Elancourt | 30,720 |
| 264 | Alencon | 30,675 |
| 265 | Sotteville-les-Rouen | 30,508 |
| 266 | Orange | 30,419 |
| 267 | Villenave-d’Ornon | 30,236 |
| 268 | Pontoise | 30,179 |
| 269 | Villiers-sur-Marne | 30,141 |
| 270 | Chatou | 29,980 |
| 271 | Goussainville | 29,936 |
| 272 | Lomme | 29,781 |
| 273 | Vierzon | 29,765 |
| 274 | Saint-Medard-en-Jalles | 29,631 |
| 275 | Thiais | 29,613 |
| 276 | Carpentras | 29,598 |
| 277 | L’Hay-les-Roses | 29,592 |
| 278 | Menton | 29,538 |
| 279 | Saint-Laurent-du-Var | 29,405 |
| 280 | Saintes | 29,401 |
| 281 | Rochefort | 29,316 |
| 282 | Malakoff | 29,309 |
| 283 | Draveil | 29,205 |
| 284 | Saint-Leu | 29,167 |
| 285 | Saint-Sebastien-sur-Loire | 29,127 |
| 286 | Le Chesnay | 29,043 |
| 287 | Tournefeuille | 29,013 |
| 288 | Clichy-sous-Bois | 28,951 |
| 289 | Chaumont | 28,870 |
| 290 | Saint-Etienne-du-Rouvray | 28,842 |
| 291 | Meyzieu | 28,818 |
| 292 | Yerres | 28,786 |
| 293 | Montbeliard | 28,754 |
| 294 | Saint-Cloud | 28,728 |
| 295 | Sens | 28,589 |
| 296 | Laon | 28,577 |
| 297 | Lambersart | 28,502 |
| 298 | Trappes | 28,256 |
| 299 | Rodez | 28,226 |
| 300 | Bergerac | 28,206 |
| 301 | Annemasse | 28,164 |
| 302 | La Garde | 28,146 |
| 303 | Ermont | 28,006 |
| 304 | Rillieux-la-Pape | 27,965 |
| 305 | Villemomble | 27,890 |
| 306 | Pierrefitte-sur-Seine | 27,803 |
| 307 | Le Kremlin-Bicetre | 27,756 |
| 308 | Champs-sur-Marne | 27,665 |
| 309 | Aix-les-Bains | 27,540 |
| 310 | Bezons | 27,459 |
| 311 | Vallauris | 27,175 |
| 312 | Taverny | 27,160 |
| 313 | Illkirch-Graffenstaden | 27,150 |
| 314 | La Teste-de-Buch | 27,142 |
| 315 | Epernay | 26,971 |
| 316 | Villiers-le-Bel | 26,917 |
| 317 | Vichy | 26,908 |
| 318 | Sannois | 26,758 |
| 319 | Gonesse | 26,647 |
| 320 | Vigneux-sur-Seine | 26,581 |
| 321 | Cavaillon | 26,578 |
| 322 | Rambouillet | 26,563 |
| 323 | Cherbourg-Octeville | 26,544 |
| 324 | Armentieres | 26,535 |
| 325 | Lunel | 26,477 |
| 326 | Cachan | 26,429 |
| 327 | Le Grand-Quevilly | 26,411 |
| 328 | Abbeville | 26,350 |
| 329 | La Garenne-Colombes | 26,274 |
| 330 | Montigny-les-Metz | 26,258 |
| 331 | Vanves | 25,957 |
| 332 | Vernon | 25,926 |
| 333 | Savigny-le-Temple | 25,814 |
| 334 | Dole | 25,767 |
| 335 | Villeneuve-sur-Lot | 25,758 |
| 336 | Les Ulis | 25,674 |
| 337 | Marseille 02 | 25,668 |
| 338 | Oyonnax | 25,586 |
| 339 | Oullins | 25,481 |
| 340 | Le Creusot | 25,479 |
| 341 | Henin-Beaumont | 25,260 |
| 342 | Orvault | 25,227 |
| 343 | Coudekerque-Branche | 25,090 |
| 344 | Herblay | 25,042 |
| 345 | Ris-Orangis | 24,971 |
| 346 | Sucy-en-Brie | 24,903 |
| 347 | Grigny | 24,829 |
| 348 | Fresnes | 24,692 |
| 349 | Bourgoin | 24,679 |
| 350 | Romainville | 24,661 |
| 351 | Fontenay-aux-Roses | 24,569 |
| 352 | Decines-Charpieu | 24,563 |
| 353 | Saint-Die-des-Vosges | 24,517 |
| 354 | Fontaine | 24,477 |
| 355 | Auch | 24,383 |
| 356 | Bruay-la-Buissiere | 24,363 |
| 357 | Lisieux | 24,362 |
| 358 | Sarreguemines | 24,335 |
| 359 | Torcy | 24,275 |
| 360 | Gradignan | 24,274 |
| 361 | Lanester | 24,241 |
| 362 | Bretigny-sur-Orge | 24,206 |
| 363 | Muret | 24,202 |
| 364 | Bois-Colombes | 24,189 |
| 365 | Blagnac | 24,152 |
| 366 | Herouville-Saint-Clair | 24,147 |
| 367 | Libourne | 24,129 |
| 368 | Le Bouscat | 24,121 |
| 369 | Miramas | 24,062 |
| 370 | Beaune | 24,051 |
| 371 | Brunoy | 23,985 |
| 372 | Eaubonne | 23,985 |
| 373 | Villeparisis | 23,820 |
| 374 | Montfermeil | 23,718 |
| 375 | Sevres | 23,613 |
| 376 | Fougeres | 23,608 |
| 377 | Saint-Pol-sur-Mer | 23,524 |
| 378 | La Madeleine | 23,461 |
| 379 | Gif-sur-Yvette | 23,430 |
| 380 | Bourgoin-Jallieu | 23,406 |
| 381 | Begles | 23,393 |
| 382 | Cahors | 23,220 |
| 383 | Hazebrouck | 23,196 |
| 384 | Millau | 23,196 |
| 385 | Grande-Synthe | 23,102 |
| 386 | La Valette-du-Var | 23,023 |
| 387 | Moulins | 22,984 |
| 388 | Mont-Saint-Aignan | 22,967 |
| 389 | Etampes | 22,901 |
| 390 | Mons-en-Baroeul | 22,895 |
| 391 | Agde | 22,890 |
| 392 | Saint-Ouen-l’Aumone | 22,866 |
| 393 | Vertou | 22,810 |
| 394 | Montgeron | 22,732 |
| 395 | Maisons-Laffitte | 22,661 |
| 396 | Le Puy-en-Velay | 22,607 |
| 397 | Le Petit-Quevilly | 22,580 |
| 398 | Lormont | 22,525 |
| 399 | Olivet | 22,493 |
| 400 | Acheres | 22,444 |
Population growth and fertility
In 2012, population growth in France was 251,000. This is the slowest growth in ten years. The number of births (822,000) was stable, but the death rate was far higher than the previous year, with 571,000 deaths.
Fertility has been stable since 2008, after increasing from 2002. It now stands at 2.01 children per woman (2012). Within the EU, only Ireland has a higher fertility rate, with 2.05 children per woman in 2011. After Ireland and France, the UK follows a fertility rate of 1.97 in 2011. Average age at birth has increased steadily in France, and in 2012 reached 30.1 years.
Increases also make the average age at the start of the first marriage, which in 2012 was 31.9 years for men and 30.1 years for women. The number of marriages was estimated at 241,000 for 2012, which was the first year with a significant increase, after many years of decline.
Population density and settlement pattern
The average population density is about 119 residents per square kilometer (2017); this is lower than in neighboring countries (except Spain). There are major regional differences. Most densely populated are the most industrialized areas, where a large proportion of the population of cities is found, as well as the large, fertile river valleys and the pronounced wine districts.
About 20 percent of the population lives in and around Paris; otherwise in the areas around the mouth of the Seine (the region of Haute-Normandie), the industrial areas to the north (Nord-Pas-de-Calais) and northeast along the border with Belgium and Germany (Alsace) and the Côte d’Azur in the south, and around the major urban areas such as Lyon and Marseille (Rhône-Alpes and Provence-Alpes-Côte d’Azur) as well as Bordeaux (Aquitaine) and parts of the Loire Valley (Pays de la Loire).
The thinner populated areas include large areas in the middle of the country, including Burgundy, Limousin and Auvergne as well as the Pyrenees and Corsica. Several of the rich agricultural areas of the Paris basin, such as Champagne, Beauce and Brie, have long had a large relocation to the Paris area. The regions of Auvergne, Limousin and Lorraine have seen a steady decline in the population since the 1980s.
Population trends
France was around 1800 and hence Europe’s most populous country after Russia. In 1801, the population was 28.2 million (within the current limits). However, during the 19th century, population growth was very low. While the population in Europe was multiplied elsewhere, France increased by less than 50 percent. Migration to other parts of the world was also low. Only half a million emigrated to America (1846–1930), a period when there was significant emigration across the Atlantic elsewhere in Europe.
The low natural population growth (born ÷ dead) was only partially offset by the fact that France was Europe’s only major immigration country in the first half of the 20th century. From about 1911, the population began to decline in absolute terms, and France’s significant losses during the First World War had long-lasting effects. Only in 1950 did France reach the level from 1911 (just under 42 million at current limits).
Birth rates increased significantly after the Second World War, not least as a result of the state’s targeted population policy, but also as a result of increased immigration from countries that have traditionally had higher birth rates. Parallel to this trend came a reduction in mortality, and population growth rose to the same level as in the other Western European countries – and was somewhat higher at times.
Since the 1990s, immigration has declined and is largely offset by emigration. In the last thirty years, the population has increased by almost 9.7 million, an increase of 17.3 percent.
Second most populous EU country
13% of EU citizens lived in France on 1 January 2012. Of the EU countries, only Germany is more populous than France, with 16.2 percent of the EU population. After Germany and France, Britain and Italy follow as the most populous in the EU. In ten years, the population in Germany has decreased by 0.7 percent, while it has increased by 6.5 percent in France, 12.1 percent in Italy and 12.5 percent in the United Kingdom.
Immigration and ethnic issues
Immigration to France increased already in the interwar period. In particular, many Italians came to the southern parts and Poles to the northern parts of the country. In addition, many Russian, Spanish and other refugees came.
A special feature of the Second World War was the immigration from the former colonies, as well as the return of French citizens from here, especially from Algeria, which became independent in 1962.
Furthermore, there has been great immigration from the French overseas territories and from Southeast Asia and West Africa. About 10 percent of the country’s residents are first- or second-generation immigrants. The largest groups come from the Maghreb countries in North Africa, Portugal and Spain.
Largest urban areas
| Location | Residents |
| Paris | 12 405 426 (2014) |
| Lyon | 2 291 763 (2015) |
| Marseille-Aix-en-Provence | 1 876 019 (2016) |
| Little | 1 182 127 (2014) |
| Toulouse | 1 312 304 (2014) |
| Bordeaux | 1 196 122 (2014) |
| Nice | 1 004 826 (2013) |
| Nantes | 873 133 (2010) |
| Strasbourg | 773 447 (2014) |
| Rennes | 671 845 (2010) |
| Grenoble | 690 548 (2014) |
| Rouen | 663 070 (2015) |
| Toulon | 606 947 (2010) |
| Montpellier | 549 491 (2010) |


