Ghana Population
In 1957, Ghana became the first former colony in West Africa to achieve independence. The country is rich in natural resources such as gold and cocoa, and has started extracting oil. Ghana is considered one of the most stable democracies in Africa.
Key figures and facts
- Capital: Accra
- Ethnic groups: Akan 47.5%, mole diary 16.6%, equally 13.9%, ga-dangme 7.4%, gurma 5.7%, guan 3.7%, gravel 2.5%, man 1.1 %, other 1.4% (2010)
- Language: Asante 16%, even 14%, fante 11.6%, boron 4.9%, dagomba 4.4%, dangme 4.2%, dagarte 3.9%, konkomba 3.5% acyem 3.2%, ga 3.1%, others, including English (official) 31.2% (2010)
- Religion: Christians 71.2%, Muslims 17.6%, traditional 5.2%, other/none 6% (2010)
- Population: 29 463 643
- Control Form: Constitutional democracy
- Area: 238 540 Km2
- Currency: Cedi
- GNP per capita: 4,292 PPP $
- National Day: March 6th
Population of Ghana
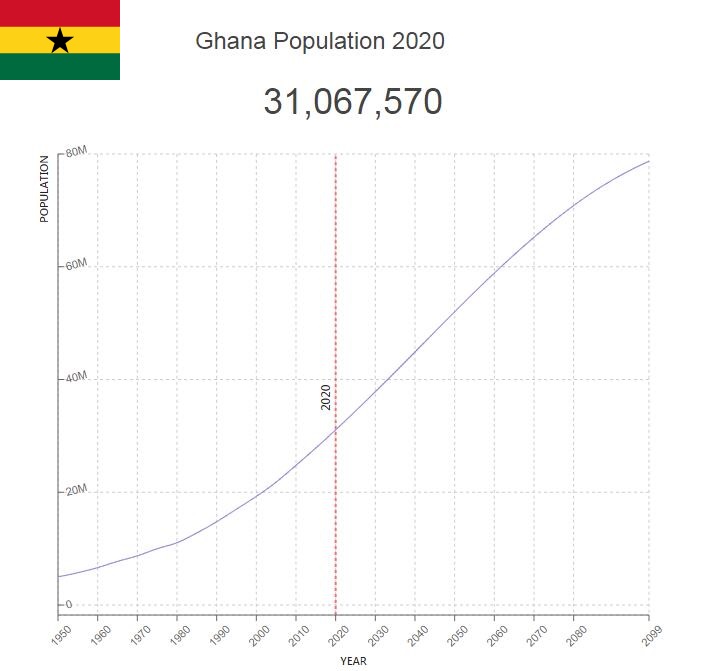
Ghana’s population was estimated at 29,340,000 in 2020. The annual population growth is 2.1 percent. Ghana has a young population, where 56 percent of the population is under 25, and only 4.4 percent are over 65 (2020).
Emigration, primarily illegal immigration to Nigeria, for many years reduced the overall population growth, but in the second half of the 1980s, an estimated 1.3 million Ghanaians were expelled from Nigeria and moved back home.
Infant mortality has been sharply reduced in recent decades, and is estimated at 32 per 1,000 live births in 2020. In 2013, the figure was 52.3 per 1,000 live births, which was half that of 1980. Each woman has an average of 3.9 children (2020).
In 2018, it was estimated that 1.7 percent of the population lived with HIV/AIDS, down from 2.3 in the year 2000. Life expectancy at birth is 70 years for women and 65.6 years for men.
Population of Ghana by Year (Historical)
| Year | Population | Annual Growth Rate | Population Density | Global Rank |
| 2020 | 31,072,829 | 2.150% | 136.5603 | 47 |
| 2019 | 30,417,745 | 2.190% | 133.6814 | 46 |
| 2018 | 29,766,991 | 2.220% | 130.8214 | 46 |
| 2017 | 29,121,354 | 2.250% | 127.9839 | 47 |
| 2016 | 28,481,834 | 2.270% | 125.1733 | 47 |
| 2015 | 27,849,094 | 2.360% | 122.3926 | 47 |
| 2010 | 24,779,508 | 2.580% | 108.9022 | 47 |
| 2005 | 21,814,531 | 2.500% | 95.8717 | 49 |
| 2000 | 19,278,745 | 2.530% | 84.7273 | 50 |
| 1995 | 17,013,946 | 2.860% | 74.7739 | 52 |
| 1990 | 14,773,166 | 2.940% | 64.9261 | 53 |
| 1985 | 12,783,502 | 2.950% | 56.1818 | 53 |
| 1980 | 11,056,005 | 2.060% | 48.5898 | 55 |
| 1975 | 9,985,835 | 2.710% | 43.8865 | 57 |
| 1970 | 8,735,384 | 2.450% | 38.3910 | 59 |
| 1965 | 7,739,362 | 3.130% | 34.0137 | 65 |
| 1960 | 6,635,119 | 2.970% | 29.1607 | 66 |
| 1955 | 5,730,483 | 2.620% | 25.1850 | 66 |
| 1950 | 5,036,035 | 0.000% | 22.1330 | 66 |
Major Cities in Ghana by Population
| Rank | City | Population |
| 1 | Accra | 1,963,153 |
| 2 | Kumasi | 1,468,498 |
| 3 | Tamale | 360,468 |
| 4 | Takoradi | 232,808 |
| 5 | Atsiaman | 202,821 |
| 6 | Tema | 155,671 |
| 7 | Teshi Old Town | 143,902 |
| 8 | Cape Coast | 142,904 |
| 9 | Sekondi-Takoradi | 138,761 |
| 10 | Obuase | 137,745 |
| 11 | Medina Estates | 101,096 |
| 12 | Koforidua | 96,155 |
| 13 | Japekrom | 95,889 |
| 14 | Wa | 77,996 |
| 15 | Ejura | 70,696 |
| 16 | Nungua | 70,372 |
| 17 | Sunyani | 70,188 |
| 18 | Ho | 69,887 |
| 19 | Techiman | 69,609 |
| 20 | Aflao | 66,435 |
| 21 | Berekum | 62,253 |
| 22 | Akim Oda | 60,493 |
| 23 | Bawku | 56,719 |
| 24 | Hohoe | 56,091 |
| 25 | Bolgatanga | 54,319 |
| 26 | Tafo | 50,346 |
| 27 | Swedru | 50,182 |
| 28 | Suhum | 49,287 |
| 29 | Dome | 47,149 |
| 30 | Kintampo | 47,074 |
| 31 | Gbawe | 44,534 |
| 32 | Nsawam | 44,411 |
| 33 | Winneba | 44,143 |
| 34 | Kasoa | 44,116 |
| 35 | Yendi | 42,861 |
| 36 | Mampong | 41,926 |
| 37 | Konongo | 41,127 |
| 38 | Asamankese | 39,324 |
| 39 | Prestea | 35,044 |
| 40 | Tarkwa | 34,830 |
| 41 | Dunkwa | 33,268 |
| 42 | Agogo | 31,443 |
| 43 | Wenchi | 31,300 |
| 44 | Anloga | 29,637 |
| 45 | Begoro | 29,405 |
| 46 | Savelugu | 29,199 |
| 47 | Kpandu | 28,223 |
| 48 | Elmina | 25,449 |
| 49 | Salaga | 25,361 |
| 50 | Navrongo | 25,359 |
| 51 | Saltpond | 24,578 |
| 52 | Axim | 24,389 |
| 53 | Akwatia | 23,655 |
| 54 | Shama Junction | 20,835 |
| 55 | Apam | 20,036 |
| 56 | Foso | 19,967 |
| 57 | Bibiani | 18,965 |
| 58 | Aburi | 18,288 |
| 59 | Keta | 17,966 |
| 60 | Bechem | 16,889 |
| 61 | Duayaw Nkwanta | 16,889 |
| 62 | Mumford | 13,872 |
| 63 | Akropong | 10,985 |
| 64 | Kete Krachi | 10,889 |
| 65 | Akim Swedru | 9,889 |
| 66 | Kibi | 9,288 |
| 67 | Mpraeso | 8,896 |
| 68 | Aboso | 8,679 |
| 69 | Kpandae | 8,541 |
Ethnic conditions
Ghana’s population is divided into almost 75 people with different languages and cultural traditions. The vast majority of the groups are very small; 65 of them individually constitute less than 1 percent of Ghana’s total population. Akanting people, including Ashanti, Fanti Abron and Anyi, dominate in the south (44 percent of the population), ga-adangme in and around the capital (around 8 percent of the population), and even further east (13 percent of the population). In the north there are a number of herb-speaking groups of people, including Dagomba, Mamprusi, Konkomba and Dagari.
Ghana’s authorities have followed a consistent policy to equalize inequalities and contradictions between ethnic groups, and conflicts on such grounds are relatively small, but there have been several cases of ethnic clashes in the northern part of the country in the mid-1990s.
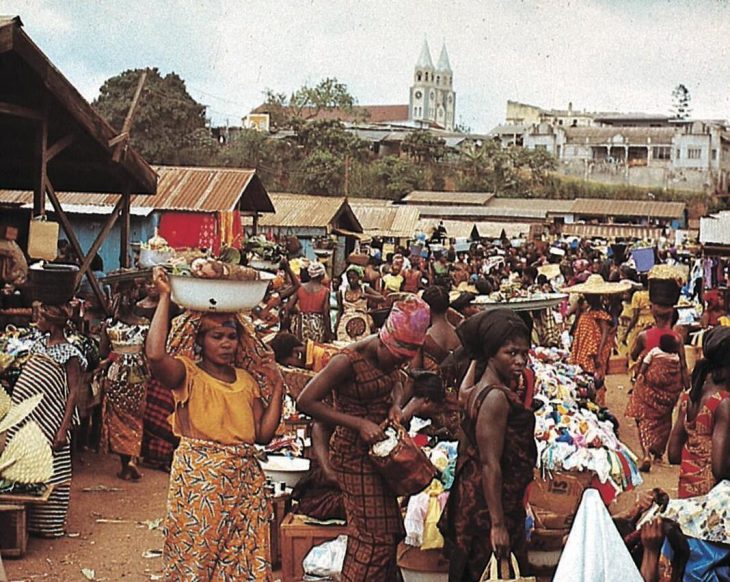
Many of Ghana’s ethnic groups traditionally have matrilineal kinship systems, and women play a key role in trade, for example. This role gives them influence in other areas as well.
Settlement
By African scale, Ghana is relatively densely populated, 113.8 residents per square kilometer (World Bank 2013). The population density is greatest in the central coastal areas. 57 percent of the population lives in cities (2020). The largest city is the capital city of Accra with about 10 percent of the population (Ghana Embassy in Washington). Other major cities are Kumasi, Tamale, Tema and Sekondi-Takoradi.
Language
The official language is English. The most widely spoken languages belong to the Gur and Kwas languages of the Niger Congo family. Mossi in the north are spoken by yeast. In the south and east, the Kwa languages predominate akan, ewe and ga-adangme.
Religion
About 38 percent practice traditional forms of religion, and many combine these with Christianity or Islam. The figures are therefore uncertain regarding the support of Islam (Sunni and Ahmadiyya), and Christianity (Presbyterians, Pentecostal and Adventist, Catholic, indigenous churches). In 2010, 71 percent were considered Christians and 17 percent as Muslims.


