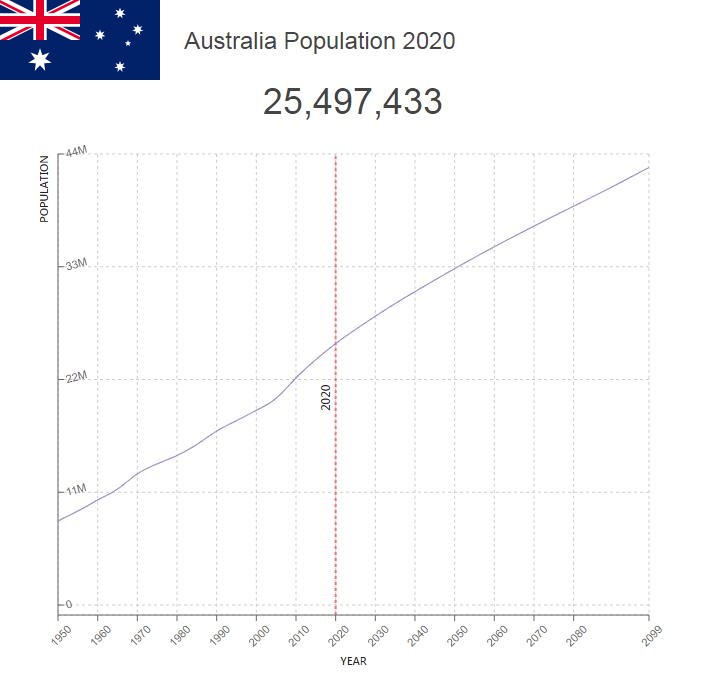
Australia Population
The country Australia was founded by European immigrants 200 years ago, but has been inhabited for over 40,000 years. An abundance of natural resources and relatively few people have made the country one of the richest in the world.
Key figures and facts
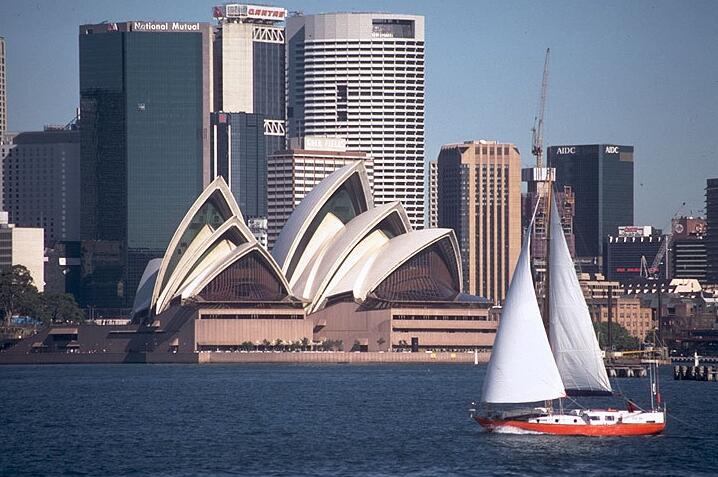
- Capital: Canberra
- Ethnic groups: English 25.9%, Australians 25.4%, Irish 7.5%, Scots 6.4%, Italian 3.3%, Germans 3.2%, Chinese 3.1%, Indian 1.4%, Greeks 1, 4%, Dutch 1.2%, other 15.8% (including Australian Indigenous people 0.5%), unspecified 5.4% (2011) (based on questions of which nationality one feels one belongs to)
- Language: English 72.7%, Mandarin 2.5%, Arabic 1.4%, Cantonese 1.2%, Vietnamese 1.2%, Italian 1.2%, Greek 1%, other 14.8%, unspecified 6.5 % (2016)
- Religion: Protestants 23.1%, Catholics 22.6%, other Christians 4.2%, Muslims 2.6% Buddhists 2.4%, Orthodox 2.3%, Hindus 1.9%, none 30.1%, others/unspecified 10.9% (2016)
- Population: 24,772,247 (2018)
- Control Form: Federal Constitutional Monarchy
- Area: 7 741 220 km2
- Currency: Australian dollars
- GNP per capita: 46 012 PPP $
- National Day: January 26th
Australia has been populated for at least 40,000 years, probably longer. The predecessors of today’s indigenous peoples came by sea from the Sunda Islands via the land bridge that united Australia and New Guinea in one single continent, Sahul. Towards the end of the 18th century, British colonists estimated that the indigenous population was somewhere between 300,000 and 1,000,000 people. On January 18, 2020, the Australian Bureau of Statistics’ Population Clock estimated that the population had reached 25 572 832. Of these, indigenous peoples made up 2.8 percent.
Population of Australia by Year (Historical)
| Year | Population | Annual Growth Rate | Population Density | Global Rank |
| 2020 | 25,499,773 | 1.180% | 3.3193 | 55 |
| 2019 | 25,203,087 | 1.230% | 3.2807 | 55 |
| 2018 | 24,898,041 | 1.270% | 3.2410 | 55 |
| 2017 | 24,584,509 | 1.330% | 3.2002 | 53 |
| 2016 | 24,262,601 | 1.380% | 3.1583 | 53 |
| 2015 | 23,932,391 | 1.560% | 3.1153 | 53 |
| 2010 | 22,154,568 | 1.890% | 2.8839 | 53 |
| 2005 | 20,178,429 | 1.220% | 2.6266 | 52 |
| 2000 | 18,991,320 | 1.090% | 2.4721 | 51 |
| 1995 | 17,992,963 | 1.190% | 2.3422 | 51 |
| 1990 | 16,960,486 | 1.600% | 2.2077 | 49 |
| 1985 | 15,663,552 | 1.430% | 2.0389 | 47 |
| 1980 | 14,588,294 | 1.160% | 1.8990 | 46 |
| 1975 | 13,773,177 | 1.490% | 1.7929 | 42 |
| 1970 | 12,792,923 | 2.490% | 1.6653 | 42 |
| 1965 | 11,313,084 | 2.010% | 1.4726 | 42 |
| 1960 | 10,241,965 | 2.250% | 1.3332 | 39 |
| 1955 | 9,165,596 | 2.310% | 1.1931 | 42 |
| 1950 | 8,177,231 | 0.000% | 1.0644 | 43 |
Major Cities in Australia by Population
| Rank | City | Population |
| 1 | Sydney | 4,627,234 |
| 2 | Melbourne | 4,246,264 |
| 3 | Brisbane | 2,189,767 |
| 4 | Perth | 1,896,437 |
| 5 | Adelaide | 1,225,124 |
| 6 | Gold Coast | 591,362 |
| 7 | Canberra | 367,641 |
| 8 | Newcastle | 308,197 |
| 9 | Wollongong | 292,079 |
| 10 | Logan City | 282,562 |
| 11 | Geelong | 225,923 |
| 12 | Hobart | 216,545 |
| 13 | Townsville | 196,108 |
| 14 | Cairns | 152,964 |
| 15 | Toowoomba | 131,147 |
| 16 | Darwin | 128,951 |
| 17 | Rockingham | 107,911 |
| 18 | Launceston | 106,042 |
| 19 | Bendigo | 100,506 |
| 20 | Ballarat | 97,826 |
| 21 | Mandurah | 83,183 |
| 22 | Mackay | 74,108 |
| 23 | Bundaberg | 70,715 |
| 24 | Bunbury | 68,137 |
| 25 | Maitland | 67,021 |
| 26 | Armadale | 62,185 |
| 27 | Rockhampton | 61,613 |
| 28 | Adelaide Hills | 60,283 |
| 29 | South Brisbane | 59,889 |
| 30 | Hervey Bay | 52,119 |
| 31 | Reservoir | 47,526 |
| 32 | Tamworth | 47,486 |
| 33 | Wagga Wagga | 46,802 |
| 34 | Albury | 45,516 |
| 35 | Berwick | 44,668 |
| 36 | Port Macquarie | 41,380 |
| 37 | Queanbeyan | 40,550 |
| 38 | Orange | 39,218 |
| 39 | Blacktown | 38,889 |
| 40 | Shepparton | 38,662 |
| 41 | Caloundra | 38,595 |
| 42 | Hoppers Crossing | 37,997 |
| 43 | Werribee | 37,626 |
| 44 | Melton | 35,379 |
| 45 | Castle Hill | 35,278 |
| 46 | Saint Albans | 34,980 |
| 47 | Nowra | 34,368 |
| 48 | Frankston | 34,346 |
| 49 | Frankston East | 34,346 |
| 50 | Rowville | 34,034 |
| 51 | Warrnambool | 33,871 |
| 52 | Baulkham Hills | 33,834 |
| 53 | Albany | 33,539 |
| 54 | Mount Waverley | 33,500 |
| 55 | St Albans | 33,400 |
| 56 | Auburn | 33,011 |
| 57 | Bathurst | 32,999 |
| 58 | Pakenham South | 32,800 |
| 59 | Point Cook | 32,302 |
| 60 | Dubbo | 32,216 |
| 61 | Epping | 32,089 |
| 62 | Wodonga | 31,494 |
| 63 | Kalgoorlie | 30,996 |
| 64 | Bankstown | 30,461 |
| 65 | Mill Park | 30,406 |
| 66 | Gladstone | 30,378 |
| 67 | Kwinana | 30,322 |
| 68 | Lismore | 29,975 |
| 69 | Mildura | 29,905 |
| 70 | Preston | 29,814 |
| 71 | Sunbury | 29,814 |
| 72 | Hurstville | 29,711 |
| 73 | Narre Warren South | 28,483 |
| 74 | Noble Park | 28,266 |
| 75 | Southport | 28,204 |
| 76 | Kellyville | 27,860 |
| 77 | Port Stephens | 27,420 |
| 78 | Banora Point | 27,257 |
| 79 | Doncaster East | 26,936 |
| 80 | Croydon | 26,835 |
| 81 | Geraldton | 26,761 |
| 82 | Maroubra | 26,427 |
| 83 | Coffs Harbour | 26,242 |
| 84 | Mosman | 26,125 |
| 85 | Richmond | 26,010 |
| 86 | Narre Warren | 25,771 |
| 87 | Randwick | 25,708 |
| 88 | Strathfield | 25,702 |
| 89 | Bundoora | 25,598 |
| 90 | Alice Springs | 25,075 |
| 91 | Quakers Hill | 24,906 |
| 92 | Endeavour Hills | 24,889 |
| 93 | Palmerston | 24,889 |
| 94 | Coburg | 24,866 |
| 95 | Dandenong | 24,808 |
| 96 | Fremantle | 24,724 |
| 97 | Ferntree Gully | 24,613 |
| 98 | Campsie | 24,430 |
| 99 | Kew | 23,765 |
| 100 | Hampton Park | 23,656 |
| 101 | Canning Vale | 23,178 |
| 102 | Glen Iris | 23,159 |
| 103 | Mount Gambier | 23,098 |
| 104 | Marrickville | 23,050 |
| 105 | Northcote | 22,809 |
| 106 | Granville | 22,778 |
| 107 | Mount Isa | 22,674 |
| 108 | Keysborough | 22,589 |
| 109 | Armidale | 22,562 |
| 110 | Morphett Vale | 22,491 |
| 111 | Dianella | 22,410 |
| 112 | Forest Lake | 22,315 |
| 113 | Mornington | 22,310 |
| 114 | Thornlie | 22,154 |
| 115 | Ashfield | 21,889 |
| 116 | Traralgon | 21,849 |
| 117 | Dandenong North | 21,799 |
| 118 | Busselton | 21,787 |
| 119 | Cabramatta | 21,672 |
| 120 | Greystanes | 21,592 |
| 121 | Tarneit | 21,579 |
| 122 | Maryborough | 21,390 |
| 123 | Caboolture | 21,367 |
| 124 | Kirwan | 21,305 |
| 125 | Langwarrin | 21,260 |
| 126 | Carlingford | 21,253 |
| 127 | Liverpool | 21,206 |
| 128 | Caringbah | 21,172 |
| 129 | Brighton | 21,146 |
| 130 | Glenferrie | 21,066 |
| 131 | Hawthorn | 21,066 |
| 132 | Hawthorn South | 21,066 |
| 133 | Goulburn | 20,829 |
| 134 | Boronia | 20,714 |
| 135 | Woodridge | 20,539 |
| 136 | Booval | 20,429 |
| 137 | Thomastown | 20,220 |
| 138 | Cheltenham | 20,181 |
| 139 | Punchbowl | 20,125 |
| 140 | Prospect | 20,106 |
| 141 | Greensborough | 20,103 |
| 142 | Gawler | 19,895 |
| 143 | Burnie | 19,861 |
| 144 | Balwyn North | 19,857 |
| 145 | Lalor | 19,762 |
| 146 | Brunswick | 19,756 |
| 147 | Hornsby | 19,752 |
| 148 | St Clair | 19,726 |
| 149 | Springvale | 19,660 |
| 150 | Wheelers Hill | 19,642 |
| 151 | Craigieburn | 19,617 |
| 152 | Whyalla | 19,534 |
| 153 | Glenroy | 19,533 |
| 154 | Camberwell | 19,526 |
| 155 | Malvern East | 19,482 |
| 156 | Murray Bridge | 19,466 |
| 157 | Echuca | 19,346 |
| 158 | Devonport | 19,206 |
| 159 | Roxburgh Park | 19,124 |
| 160 | Glenmore Park | 19,089 |
| 161 | Epping | 18,858 |
| 162 | Ballajura | 18,841 |
| 163 | Essendon | 18,741 |
| 164 | Cherrybrook | 18,667 |
| 165 | Altona Meadows | 18,635 |
| 166 | Cranbourne | 18,511 |
| 167 | Katoomba | 18,482 |
| 168 | Surfers Paradise | 18,390 |
| 169 | Parramatta | 18,337 |
| 170 | Broken Hill | 18,319 |
| 171 | Doncaster | 18,248 |
| 172 | Eltham | 18,051 |
| 173 | Fairfield | 17,970 |
| 174 | Morayfield | 17,909 |
| 175 | Engadine | 17,826 |
| 176 | Eastwood | 17,754 |
| 177 | Saint Kilda | 17,684 |
| 178 | Highton | 17,682 |
| 179 | Mulgrave | 17,536 |
| 180 | Forster | 17,480 |
| 181 | Wantirna South | 17,366 |
| 182 | Dee Why | 17,352 |
| 183 | Thornbury | 17,323 |
| 184 | Wahroonga | 17,260 |
| 185 | Frankston South | 17,249 |
| 186 | Wyndham Vale | 17,193 |
| 187 | Gosnells | 17,166 |
| 188 | Mount Eliza | 17,137 |
| 189 | Willetton | 17,132 |
| 190 | Carrum Downs | 17,102 |
| 191 | North Ryde | 17,097 |
| 192 | Mount Martha | 16,976 |
| 193 | Wangaratta | 16,734 |
| 194 | Sunnybank Hills | 16,719 |
| 195 | Cronulla | 16,643 |
| 196 | Sunshine West | 16,632 |
| 197 | Taree | 16,510 |
| 198 | Earlwood | 16,453 |
| 199 | Sunnybank | 16,331 |
| 200 | South Grafton | 16,288 |
| 201 | Cessnock | 16,282 |
| 202 | Hillside | 16,215 |
| 203 | Westmead | 16,198 |
| 204 | Carnegie | 16,188 |
| 205 | Nerang | 16,145 |
| 206 | Narangba | 16,112 |
| 207 | Deer Park | 16,093 |
| 208 | Taylors Lakes | 15,984 |
| 209 | Deception Bay | 15,979 |
| 210 | Umina | 15,948 |
| 211 | Seaford | 15,922 |
| 212 | Burwood | 15,919 |
| 213 | Yagoona | 15,892 |
| 214 | West Pennant Hills | 15,856 |
| 215 | Paralowie | 15,761 |
| 216 | Lilydale | 15,538 |
| 217 | Moe | 15,471 |
| 218 | Clayton | 15,432 |
| 219 | Lara | 15,409 |
| 220 | Griffith | 15,344 |
| 221 | Bracken Ridge | 15,244 |
| 222 | Eight Mile Plains | 15,211 |
| 223 | Parafield Gardens | 15,206 |
| 224 | Prestons | 15,202 |
| 225 | Buderim | 15,117 |
| 226 | Brighton East | 15,056 |
| 227 | Carindale | 15,024 |
| 228 | Port Hedland | 14,933 |
| 229 | Duncraig | 14,915 |
| 230 | Pascoe Vale | 14,889 |
| 231 | Rochedale South | 14,885 |
| 232 | Coorparoo | 14,833 |
| 233 | Meadow Heights | 14,732 |
| 234 | Mitcham | 14,700 |
| 235 | Casula | 14,585 |
| 236 | Bossley Park | 14,474 |
| 237 | Cranbourne North | 14,459 |
| 238 | Caulfield North | 14,443 |
| 239 | Lakemba | 14,357 |
| 240 | Kingston | 14,260 |
| 241 | Grovedale | 14,197 |
| 242 | Horsham | 14,174 |
| 243 | Bentleigh | 14,160 |
| 244 | Ballina | 14,131 |
| 245 | Kingsford | 14,121 |
| 246 | Lidcombe | 14,050 |
| 247 | Carlton | 13,993 |
| 248 | Wantirna | 13,867 |
| 249 | Manly | 13,838 |
| 250 | Ingleburn | 13,791 |
| 251 | Burleigh Waters | 13,757 |
| 252 | Elwood | 13,674 |
| 253 | Cleveland | 13,665 |
| 254 | Victoria Point | 13,644 |
| 255 | Yarraville | 13,636 |
| 256 | Singleton | 13,554 |
| 257 | Bongaree | 13,538 |
| 258 | Raymond Terrace | 13,495 |
| 259 | Mount Druitt | 13,471 |
| 260 | Bacchus Marsh | 13,464 |
| 261 | Newtown | 13,441 |
| 262 | Moonee Ponds | 13,421 |
| 263 | Palm Beach | 13,383 |
| 264 | Ascot Vale | 13,364 |
| 265 | Morwell | 13,288 |
| 266 | Port Melbourne | 13,182 |
| 267 | Yeppoon | 13,174 |
| 268 | Keilor East | 13,148 |
| 269 | Port Augusta | 13,146 |
| 270 | Port Pirie | 13,095 |
| 271 | Footscray | 13,092 |
| 272 | Williamstown | 13,092 |
| 273 | Sale | 13,075 |
| 274 | Coogee | 13,068 |
| 275 | Templestowe Lower | 13,041 |
| 276 | Brunswick West | 13,037 |
| 277 | Hawthorn East | 13,022 |
| 278 | Surrey Hills | 13,022 |
| 279 | Port Lincoln | 12,933 |
| 280 | Doonside | 12,920 |
| 281 | Concord | 12,897 |
| 282 | Toongabbie | 12,892 |
| 283 | Dulwich Hill | 12,870 |
| 284 | Balwyn | 12,833 |
| 285 | Miranda | 12,792 |
| 286 | Toorak | 12,760 |
| 287 | Beaumaris | 12,718 |
| 288 | Port Kennedy | 12,705 |
| 289 | Broome | 12,655 |
| 290 | Fawkner | 12,485 |
| 291 | Scarborough | 12,482 |
| 292 | St Kilda East | 12,465 |
| 293 | Inala | 12,457 |
| 294 | Warwick | 12,451 |
| 295 | Rosebud | 12,390 |
| 296 | Hampton | 12,371 |
| 297 | Como | 12,314 |
| 298 | Ashwood | 12,309 |
| 299 | Chadstone | 12,246 |
| 300 | Marsfield | 12,236 |
| 301 | Kiama | 12,175 |
| 302 | Mayfield | 12,137 |
| 303 | Leichhardt | 12,137 |
| 304 | Springvale South | 12,073 |
| 305 | Goonellabah | 12,026 |
| 306 | Port Augusta West | 12,022 |
| 307 | Geelong West | 12,010 |
| 308 | Lavington | 11,921 |
| 309 | Doreen | 11,889 |
| 310 | Newport | 11,876 |
| 311 | Greenvale | 11,858 |
| 312 | Blackburn | 11,847 |
| 313 | Burwood | 11,775 |
| 314 | West Ryde | 11,756 |
| 315 | Kingswood Park | 11,702 |
| 316 | Penrith | 11,702 |
| 317 | Varsity Lakes | 11,685 |
| 318 | Donvale | 11,684 |
| 319 | Muswellbrook | 11,680 |
| 320 | Taylors Hill | 11,674 |
| 321 | Bateau Bay | 11,648 |
| 322 | North Melbourne | 11,644 |
| 323 | Wynnum West | 11,634 |
| 324 | Karratha | 11,617 |
| 325 | Charlestown | 11,614 |
| 326 | Wynnum | 11,608 |
| 327 | Penshurst | 11,581 |
| 328 | Mentone | 11,556 |
| 329 | Paddington | 11,550 |
| 330 | Caringbah South | 11,494 |
| 331 | Clayton South | 11,489 |
| 332 | Happy Valley | 11,420 |
| 333 | Diamond Creek | 11,393 |
| 334 | Redfern | 11,371 |
| 335 | North Fitzroy | 11,362 |
| 336 | Warnbro | 11,310 |
| 337 | Vermont South | 11,305 |
| 338 | Sandy Bay | 11,223 |
| 339 | East Maitland | 11,199 |
| 340 | South Perth | 11,190 |
| 341 | Lithgow | 11,187 |
| 342 | Bayswater | 11,129 |
| 343 | Manly West | 11,084 |
| 344 | Parkdale | 11,074 |
| 345 | Caulfield South | 11,002 |
| 346 | Gympie | 10,916 |
| 347 | Bairnsdale | 10,894 |
| 348 | Bowen | 10,872 |
| 349 | Nunawading | 10,836 |
| 350 | Samford Valley | 10,820 |
| 351 | Wanneroo | 10,820 |
| 352 | Mount Gravatt East | 10,780 |
| 353 | Altona North | 10,775 |
| 354 | Caroline Springs | 10,769 |
| 355 | Bulleen | 10,757 |
| 356 | Kensington | 10,736 |
| 357 | Gladesville | 10,724 |
| 358 | Menai | 10,670 |
| 359 | Bondi Beach | 10,637 |
| 360 | Wellington Point | 10,602 |
| 361 | Mount Lawley | 10,592 |
| 362 | Annerley | 10,553 |
| 363 | Tewantin | 10,549 |
| 364 | Box Hill North | 10,538 |
| 365 | Sunshine North | 10,526 |
| 366 | Yokine | 10,502 |
| 367 | Batemans Bay | 10,446 |
| 368 | Camp Hill | 10,422 |
| 369 | Marangaroo | 10,408 |
| 370 | Dapto | 10,367 |
| 371 | Maylands | 10,336 |
| 372 | Drummoyne | 10,274 |
| 373 | Melton West | 10,270 |
| 374 | Bondi | 10,262 |
| 375 | Sydenham | 10,212 |
| 376 | Keilor Downs | 10,196 |
| 377 | Neutral Bay | 10,165 |
| 378 | Highett | 10,152 |
| 379 | West Footscray | 10,111 |
| 380 | Nambour | 10,110 |
| 381 | Rutherford | 10,071 |
| 382 | Maribyrnong | 10,054 |
| 383 | Hallam | 10,051 |
| 384 | Hillarys | 10,049 |
| 385 | Burwood East | 10,030 |
| 386 | Blackburn South | 10,018 |
| 387 | Darlinghurst | 10,017 |
| 388 | Hamilton | 9,993 |
| 389 | Dingley Village | 9,961 |
| 390 | Glenorchy | 9,951 |
| 391 | Forest Hill | 9,941 |
| 392 | Kilsyth | 9,932 |
| 393 | Parkes | 9,915 |
| 394 | Nedlands | 9,909 |
| 395 | Moranbah | 9,889 |
| 396 | Broadmeadows | 9,874 |
| 397 | Grafton | 9,844 |
| 398 | Altona | 9,807 |
| 399 | Vermont | 9,791 |
| 400 | Dalby | 9,736 |
Today’s population composition
At the 2016 census, the population was 23,401,892, with a median age of 38 years. 50.7 percent of the population were women while 49.3 percent were men. The most commonly reported origins were English (25 percent), Australian (non-indigenous, 23.3 percent), Irish (7.6 percent), Scottish (6.4 percent) and Chinese (3.9 percent). The Australian indigenous population comprised 2.8 percent of the population. Of the total population, 15,614,835 people, or 66.7 percent, were born in Australia, which means the immigrant population is among the highest in the world. The most common birth countries include England (3.9 percent), New Zealand (2.2 percent), Mainland China (2.2 percent), India (1.9 percent) and the Philippines (1 percent).
In 2016, Australia was ranked as the world’s third least populous country, after Namibia and Mongolia, with 3.1 people per km². However, this is of little significance given that 86 percent of the population lived in cities. 33 percent of the indigenous population also lived in cities.
The Australian indigenous population consists of several groups of Aborigines (including Tasmania) and islanders from the Torres Strait. These have faced a host of massacres and assaults, first from British settlers and then from the federal state. Nor were they counted in the census before 1967. In the so-called Mabo case in 1992, the Australian court declared the terra nullius doctrine invalid in cases where people already occupied a given area. That is, the court recognized traditional legal systems as valid in cases where they still existed. This paved the way for indigenous peoples to claim back historic lands under a so-called Native Title Act. Despite increased pressure and calls for repeated investigative reports from the early 1990s, Australia did not make a public apology for the gross abuses committed against several generations of indigenous people until 2008.
Today, Australian indigenous peoples are experiencing persistent discrimination. Although Australian authorities have implicated a so-called Closing the Gap policy, which aims to improve the living conditions of indigenous peoples, there are still significant social differences between indigenous peoples and others. This has implications for health problems, low levels of education, alcoholism, unemployment, prison rates and lack of political representation.
Immigration policy and asylum seekers
In the 1970s, immigration demographics changed drastically as a result of numerous military conflicts worldwide. Among these were the Indochinese war, Indonesia’s siege of East Timor and the rise of several South American dictators. In light of this, Australia changed immigration policy, from White Australia to an embrace of multiculturalism. In recent years, immigration has contributed to about half of the annual population growth in Australia.
Australia’s asylum policy has been markedly bipartisan since World War II. On the one hand, they have been at the top of the world when it comes to receiving asylum seekers. On the other hand, they have failed to provide lasting solutions for those to come. Australian asylum policy is and has also been controversial, especially with regard to the offshore processing of paperless refugees. Many of these are denied access to Australia and are instead transported to asylum camps in the Pacific, such as Manus in Papua New Guinea and Nauru. Although the Manus camp was officially closed in 2017, there were 422 people left there in February 2019.
Religion
In 2016, the “non-religious” category was the largest among respondents, with 29.6 percent. Yet, as a whole, Christianity represented the largest religious group at 57.7 percent, with Catholicism representing 22.6 percent and Anglicanism 13.3 percent of the total population. In addition, 8.2 percent of the population belongs to non-Christian religions, such as Islam, Buddhism, Hinduism, Sikhism, Judaism and bahá’í. In 2001, 0.03 percent reported following traditional Aboriginal religions.
Language
Australia has no official language, but in practice English is a national language. At the 2016 census, 72.7 percent stated that they only spoke English at home. At the same time, 22.2 percent said they spoke a non-English language at home. In 2016, the five most common languages other than English were Mandarin (2.5 percent), Arabic (1.4 percent), Cantonese (1.2 percent), Vietnamese (1.2 percent) and Italian (1.2 percent).
It is common to estimate that there were around 250 different languages among the Australian indigenous peoples at the beginning of British colonial rule. Since the distinction between language and dialect is arbitrary, this list can include over 360 languages if you count with those languages with less variation than Norwegian and Danish. Nevertheless, only 20 of these were used by people of all age groups at the beginning of the previous decade.
History
Early settlement
The first migrants spread rapidly around the entire Australian coast. For example, the southwestern part of Western Australia was already populated 40,000 years ago. About 10,000 years ago, the sea level rose enough for the Australian continent to form a separate land mass, separate from New Guinea in the northeast and Tasmania in the southeast. However, Aboriginal groups along the north coast maintained extensive contact and trade with islanders in the Torres Strait and today’s Papua New Guinea.
Recent DNA studies indicate a significant contribution of Aboriginal DNA from India to just over 4,000 years ago. This deposit could mean a migration wave directly from India to Australia, or their DNA may have traveled through a wide range of cultural encounters between different populations until it ended in Australia. In any case, this indicates a widespread cultural contact between Australian Aborigines and the outside world long before British colonization.
Colonial times and early immigration waves
On February 7, 1788, two weeks after the first naval prisoner fleet arrived in Sydney Cove, the United Kingdom declared the New South Wales Colony as established. Over the next eighty years, around 165,000 people had arrived in Australia as a criminal. Nevertheless, many free settlers traveled to the newly established colonies during the same period. States such as South Australia and Victoria were established by free settlers.
In 1851 gold was found in several places in New South Wales, Victoria and Tasmania, leading to a gold fever similar to that ravaged in California from 1848. This was particularly evident in Victoria, where the massive entry of European fortune hunters resulted a population growth from 77 245 in 1851 to 538 628 a decade later.
In connection with a constantly accelerating colonial development and economic development during the latter half of the 19th century, British government decided to subsidize immigration to Australia, mainly from the British Isles and Northern Europe.
Australia’s whiteness policy
From the founding of the federal state in 1901 and up to the end of World War II, Australia had an immigration policy aimed at restricting immigration from people of non-European ethnic background. The term “White Australia policy” covers a number of statutes, including the Immigration Restriction Act of 1901, which helped to strengthen this policy. White Australia policy was mainly aimed at Asians and Pacific people.
In the decades following World War II, the hard line of immigration policy gradually faded. For example, the Immigration Restriction Act was replaced by the Migration Act in 1958, which meant, among other things, an end to the dictation test, which required flawless spelling of fifty words in any European language. Nevertheless, White Australia policy was not officially liquidated until 1973. Only then were laws passed that said race should not be a criterion in immigration regulations.


