Poland Population
Poland has had good economic development since the fall of communism. In recent years, the country has taken steps in an undemocratic direction.
Key figures and facts
- Capital: Warsaw
- Ethnic groups: Poles 97%, Silesians 1%, Germans/Ukrainians/others 2% (2011)
- Language: Polish (official) 98%, Silesian 1%, other/unspecified 3% (2011) (the figures come from a survey, the total is more than 100% because people stated more than one language.)
- Religion: Catholics 87%, Orthodox 1% Protestants/unspecified/others 12% (2012)
- Population: 38 171 000
- Control Form: Democratic Republic
- Area: 312 680 km2
- Currency: Złoty
- GNP per capita: 27 383 PPP $
- National Day: November 11th
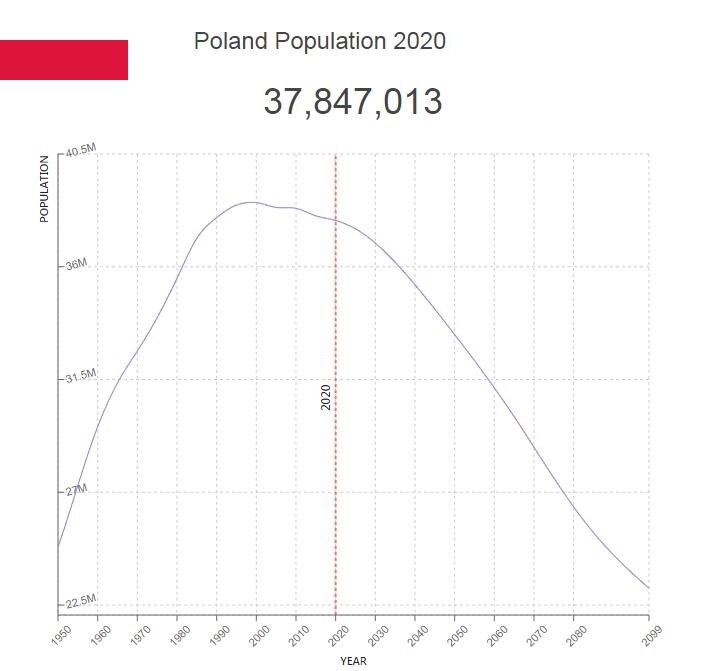
Poland has a population of 38 420 687 residents (2018, CIA World Factbook). This makes Poland the most populous of the new EU countries in Central and Eastern Europe.
In 2018, the number of residents was reduced by 0.16 percent. There has been a corresponding annual reduction in population since 2000. This is linked to a low birth rate of 1.36 percent (2018) and emigration. Against this background, with a view to, among other things, promoting population growth, a system of child benefit was introduced on April 1, 2016, which means that families with more than one child will receive PLN 500 (approximately NOK 1150) per month in child benefit per child, but not for the first child. Approximately 2.7 million families received such support in 2018. From September 2019 child benefit was also provided for the first child.
However, the Polish Statistics Agency’s projections show that by 2050 the country’s population will be reduced to approximately 34 million residents.
In 2016, Poland had a population density of 125.47 per square kilometer. Life expectancy at birth increased from 74.0 years in 1990 to 77.9 years in 2018 for the population as a whole, for women to 82.0 years and for men 74.1 years.
Population of Poland by Year (Historical)
| Year | Population | Annual Growth Rate | Population Density | Global Rank |
| 2020 | 37,846,500 | -0.110% | 123.5888 | 38 |
| 2019 | 37,887,657 | -0.090% | 123.7232 | 38 |
| 2018 | 37,921,481 | -0.080% | 123.8337 | 37 |
| 2017 | 37,953,069 | -0.090% | 123.9368 | 36 |
| 2016 | 37,989,109 | -0.120% | 124.0545 | 36 |
| 2015 | 38,033,968 | -0.150% | 124.2010 | 36 |
| 2010 | 38,329,670 | -0.020% | 125.1666 | 33 |
| 2005 | 38,368,838 | -0.100% | 125.2946 | 32 |
| 2000 | 38,556,582 | 0.050% | 125.9076 | 30 |
| 1995 | 38,458,527 | 0.260% | 125.5874 | 29 |
| 1990 | 37,960,082 | 0.440% | 123.9597 | 27 |
| 1985 | 37,133,759 | 0.880% | 121.2614 | 27 |
| 1980 | 35,539,609 | 0.910% | 116.0556 | 25 |
| 1975 | 33,970,613 | 0.800% | 110.9321 | 24 |
| 1970 | 32,639,147 | 0.800% | 106.5841 | 23 |
| 1965 | 31,360,796 | 1.150% | 102.4096 | 20 |
| 1960 | 29,614,090 | 1.660% | 96.7057 | 19 |
| 1955 | 27,269,638 | 1.900% | 89.0499 | 19 |
| 1950 | 24,823,907 | 0.000% | 81.0633 | 18 |
Major Cities in Poland by Population
| Rank | City | Population |
| 1 | Warsaw | 1,702,028 |
| 2 | Lodz | 768,644 |
| 3 | Krakow | 754,939 |
| 4 | Wroclaw | 634,782 |
| 5 | Poznan | 570,241 |
| 6 | Gdansk | 461,754 |
| 7 | Szczecin | 407,700 |
| 8 | Bydgoszcz | 366,341 |
| 9 | Lublin | 359,933 |
| 10 | Katowice | 317,205 |
| 11 | Bialystok | 291,744 |
| 12 | Gdynia | 253,619 |
| 13 | Czestochowa | 248,014 |
| 14 | Sosnowiec | 227,184 |
| 15 | Radom | 226,683 |
| 16 | Mokotow | 212,559 |
| 17 | Torun | 208,606 |
| 18 | Kielce | 208,487 |
| 19 | Gliwice | 198,724 |
| 20 | Zabrze | 192,066 |
| 21 | Bytom | 189,075 |
| 22 | Praga Poludnie | 187,734 |
| 23 | Bielsko-Biala | 176,404 |
| 24 | Olsztyn | 171,692 |
| 25 | Rzeszow | 158,271 |
| 26 | Ursynow | 147,565 |
| 27 | Ruda Slaska | 146,078 |
| 28 | Wola | 143,885 |
| 29 | Rybnik | 142,399 |
| 30 | Bielany | 134,743 |
| 31 | Srodmiescie | 134,195 |
| 32 | Dabrowa Gornicza | 130,490 |
| 33 | Tychy | 129,889 |
| 34 | Opole | 127,565 |
| 35 | Elblag | 127,447 |
| 36 | Plock | 127,363 |
| 37 | Walbrzych | 127,320 |
| 38 | Gorzow Wielkopolski | 124,319 |
| 39 | Targowek | 124,205 |
| 40 | Wloclawek | 120,228 |
| 41 | Zielona Gora | 118,322 |
| 42 | Tarnow | 117,688 |
| 43 | Chorzow | 113,319 |
| 44 | Kalisz | 108,648 |
| 45 | Koszalin | 107,339 |
| 46 | Legnica | 105,922 |
| 47 | Bemowo | 102,282 |
| 48 | Grudziadz | 99,375 |
| 49 | Slupsk | 98,497 |
| 50 | Jaworzno | 96,430 |
| 51 | Jastrzebie Zdroj | 95,702 |
| 52 | Praga Polnoc | 93,081 |
| 53 | Ochota | 93,081 |
| 54 | Bialoleka | 89,213 |
| 55 | Jelenia Gora | 87,199 |
| 56 | Nowy Sacz | 84,265 |
| 57 | Konin | 81,147 |
| 58 | Piotrkow Trybunalski | 80,017 |
| 59 | Inowroclaw | 77,486 |
| 60 | Lubin | 77,421 |
| 61 | Siedlce | 77,074 |
| 62 | Pila | 75,421 |
| 63 | Myslowice | 75,170 |
| 64 | Ostrowiec Swietokrzyski | 73,878 |
| 65 | Siemianowice Slaskie | 73,010 |
| 66 | Ostrow Wielkopolski | 72,787 |
| 67 | Stargard | 71,113 |
| 68 | Pabianice | 70,431 |
| 69 | Gniezno | 70,158 |
| 70 | Fordon | 69,889 |
| 71 | Suwalki | 69,111 |
| 72 | Glogow | 68,419 |
| 73 | Chelm | 67,932 |
| 74 | Tomaszow Mazowiecki | 67,086 |
| 75 | Przemysl | 66,902 |
| 76 | Stalowa Wola | 66,384 |
| 77 | Zamosc | 65,923 |
| 78 | Kedzierzyn-Kozle | 65,525 |
| 79 | Lomza | 63,612 |
| 80 | Leszno | 63,454 |
| 81 | Zory | 63,063 |
| 82 | Belchatow | 62,785 |
| 83 | Wawer | 62,545 |
| 84 | Mielec | 60,882 |
| 85 | Tarnowskie Gory | 60,827 |
| 86 | Swidnica | 60,240 |
| 87 | Tczew | 60,022 |
| 88 | Piekary Slaskie | 59,646 |
| 89 | Raciborz | 58,353 |
| 90 | Bedzin | 58,125 |
| 91 | Zgierz | 57,925 |
| 92 | Biala Podlaska | 57,430 |
| 93 | Elk | 55,658 |
| 94 | Swietochlowice | 55,489 |
| 95 | Pruszkow | 55,260 |
| 96 | Ostroleka | 53,629 |
| 97 | Starachowice | 53,628 |
| 98 | Zawiercie | 53,048 |
| 99 | Zoliborz | 50,823 |
| 100 | Legionowo | 50,675 |
| 101 | Tarnobrzeg | 50,348 |
| 102 | Pulawy | 49,648 |
| 103 | Wodzislaw Slaski | 49,410 |
| 104 | Skarzysko-Kamienna | 49,299 |
| 105 | Radomsko | 49,064 |
| 106 | Skierniewice | 48,931 |
| 107 | Kutno | 48,212 |
| 108 | Starogard Gdanski | 48,091 |
| 109 | Krosno | 47,673 |
| 110 | Debica | 47,255 |
| 111 | Ursus | 47,174 |
| 112 | Nysa | 47,172 |
| 113 | Wejherowo | 46,709 |
| 114 | Ciechanow | 46,327 |
| 115 | Rumia | 44,680 |
| 116 | Zdunska Wola | 44,404 |
| 117 | Sieradz | 44,325 |
| 118 | Kolobrzeg | 44,266 |
| 119 | Otwock | 43,277 |
| 120 | Zyrardow | 41,068 |
| 121 | Oswiecim | 41,032 |
| 122 | Swinoujscie | 40,808 |
| 123 | Boleslawiec | 40,571 |
| 124 | Nowa Sol | 40,243 |
| 125 | Sopot | 40,031 |
| 126 | Jaroslaw | 40,023 |
| 127 | Swidnik | 39,939 |
| 128 | Chrzanow | 39,862 |
| 129 | Knurow | 39,633 |
| 130 | Sanok | 39,573 |
| 131 | Chojnice | 39,296 |
| 132 | Mikolow | 38,710 |
| 133 | Zary | 38,668 |
| 134 | Malbork | 38,544 |
| 135 | Szczecinek | 38,385 |
| 136 | Sochaczew | 38,156 |
| 137 | Brzeg | 38,148 |
| 138 | Jaslo | 37,740 |
| 139 | Olkusz | 37,633 |
| 140 | Kwidzyn | 37,490 |
| 141 | Minsk Mazowiecki | 36,916 |
| 142 | Olesnica | 36,845 |
| 143 | Wolomin | 36,481 |
| 144 | Piaseczno | 36,167 |
| 145 | Wlochy | 36,165 |
| 146 | Krasnik | 35,723 |
| 147 | Cieszyn | 35,475 |
| 148 | Lebork | 35,050 |
| 149 | Czechowice-Dziedzice | 34,592 |
| 150 | Police | 34,239 |
| 151 | Czeladz | 34,197 |
| 152 | Dzierzoniow | 34,057 |
| 153 | Nowy Targ | 33,652 |
| 154 | Ostroda | 33,413 |
| 155 | Myszkow | 33,162 |
| 156 | Zgorzelec | 33,136 |
| 157 | Ilawa | 32,446 |
| 158 | Zywiec | 32,021 |
| 159 | Olawa | 30,787 |
| 160 | Bielawa | 30,713 |
| 161 | Lukow | 30,354 |
| 162 | Srem | 30,293 |
| 163 | Gizycko | 29,861 |
| 164 | Lowicz | 29,698 |
| 165 | Augustow | 29,641 |
| 166 | Turek | 29,422 |
| 167 | Mlawa | 29,287 |
| 168 | Krotoszyn | 29,120 |
| 169 | Bochnia | 29,073 |
| 170 | Swarzedz | 28,899 |
| 171 | Czerwionka-Leszczyny | 28,629 |
| 172 | Wrzesnia | 28,592 |
| 173 | Gorlice | 28,498 |
| 174 | Gierloz | 28,240 |
| 175 | Ketrzyn | 28,060 |
| 176 | Klodzko | 27,830 |
| 177 | Nowy Dwor Mazowiecki | 27,522 |
| 178 | Zakopane | 27,469 |
| 179 | Brodnica | 27,230 |
| 180 | Bilgoraj | 26,876 |
| 181 | Grodzisk Mazowiecki | 26,573 |
| 182 | Wyszkow | 26,517 |
| 183 | Bielsk Podlaski | 26,382 |
| 184 | Lubon | 26,320 |
| 185 | Zagan | 26,140 |
| 186 | Szczytno | 25,933 |
| 187 | Kluczbork | 25,867 |
| 188 | Walcz | 25,860 |
| 189 | Swiecie | 25,732 |
| 190 | Jarocin | 25,554 |
| 191 | Bartoszyce | 25,549 |
| 192 | Pszczyna | 25,177 |
| 193 | Sandomierz | 24,976 |
| 194 | Kabaty | 24,889 |
| 195 | Nowa Ruda | 24,642 |
| 196 | Wagrowiec | 24,317 |
| 197 | Wielun | 24,273 |
| 198 | Bialogard | 24,154 |
| 199 | Lubliniec | 24,022 |
| 200 | Koscian | 23,985 |
| 201 | Jawor | 23,754 |
| 202 | Skawina | 23,536 |
| 203 | Pruszcz Gdanski | 23,507 |
| 204 | Kolo | 23,382 |
| 205 | Zabki | 23,362 |
| 206 | Koscierzyna | 23,250 |
| 207 | Prudnik | 23,232 |
| 208 | Piastow | 23,179 |
| 209 | Swiebodzice | 23,117 |
| 210 | Marki | 23,066 |
| 211 | Zambrow | 22,746 |
| 212 | Lubartow | 22,728 |
| 213 | Grajewo | 22,692 |
| 214 | Ostrow Mazowiecka | 22,542 |
| 215 | Opoczno | 22,481 |
| 216 | Goleniow | 22,394 |
| 217 | Luban | 22,134 |
| 218 | Plonsk | 22,106 |
| 219 | Hajnowka | 22,046 |
| 220 | Laziska Gorne | 21,872 |
| 221 | Mragowo | 21,854 |
| 222 | Andrychow | 21,843 |
| 223 | Rembertow | 21,782 |
| 224 | Rydultowy | 21,776 |
| 225 | Sroda Wielkopolska | 21,646 |
| 226 | Swiebodzin | 21,646 |
| 227 | Kamienna Gora | 21,632 |
| 228 | Leczna | 21,608 |
| 229 | Polkowice | 21,454 |
| 230 | Rawicz | 21,269 |
| 231 | Gryfino | 21,159 |
| 232 | Dzialdowo | 21,016 |
| 233 | Gostyn | 20,660 |
| 234 | Konskie | 20,645 |
| 235 | Ozorkow | 20,497 |
| 236 | Chelmno | 20,465 |
| 237 | Aleksandrow Lodzki | 20,181 |
| 238 | Tomaszow Lubelski | 20,150 |
| 239 | Strzelce Opolskie | 20,130 |
| 240 | Wesola | 19,889 |
| 241 | Pionki | 19,855 |
| 242 | Chodziez | 19,665 |
| 243 | Bierun | 19,548 |
| 244 | Naklo nad Notecia | 19,454 |
| 245 | Krasnystaw | 19,421 |
| 246 | Kety | 19,138 |
| 247 | Wadowice | 19,127 |
| 248 | Pisz | 19,121 |
| 249 | Sokolka | 18,968 |
| 250 | Pultusk | 18,928 |
| 251 | Pyskowice | 18,907 |
| 252 | Gostynin | 18,865 |
| 253 | Sierpc | 18,755 |
| 254 | Trzebinia | 18,717 |
| 255 | Bogatynia | 18,577 |
| 256 | Kozienice | 18,566 |
| 257 | Wieliczka | 18,566 |
| 258 | Miedzyrzecz | 18,558 |
| 259 | Hrubieszow | 18,494 |
| 260 | Szamotuly | 18,477 |
| 261 | Lask | 18,466 |
| 262 | Orzesze | 18,327 |
| 263 | Sulejowek | 18,303 |
| 264 | Zlotow | 18,284 |
| 265 | Braniewo | 18,245 |
| 266 | Krapkowice | 18,164 |
| 267 | Lancut | 18,155 |
| 268 | Sokolow Podlaski | 18,130 |
| 269 | Reda | 18,005 |
| 270 | Kostrzyn nad Odra | 17,988 |
| 271 | Sulechow | 17,944 |
| 272 | Oborniki | 17,804 |
| 273 | Jozefow | 17,799 |
| 274 | Libiaz | 17,723 |
| 275 | Deblin | 17,664 |
| 276 | Rawa Mazowiecka | 17,659 |
| 277 | Myslenice | 17,575 |
| 278 | Kobylka | 17,548 |
| 279 | Pleszew | 17,529 |
| 280 | Slubice | 17,456 |
| 281 | Zielonka | 17,407 |
| 282 | Radlin | 17,368 |
| 283 | Konstantynow Lodzki | 17,304 |
| 284 | Radzionkow | 17,056 |
| 285 | Miedzyrzec Podlaski | 17,047 |
| 286 | Busko-Zdroj | 16,984 |
| 287 | Strzegom | 16,893 |
| 288 | Trzcianka | 16,803 |
| 289 | Brzesko | 16,755 |
| 290 | Jedrzejow | 16,681 |
| 291 | Boguszow-Gorce | 16,615 |
| 292 | Bytow | 16,613 |
| 293 | Gryfice | 16,609 |
| 294 | Przasnysz | 16,607 |
| 295 | Nowogard | 16,592 |
| 296 | Gubin | 16,518 |
| 297 | Zlotoryja | 16,501 |
| 298 | Rypin | 16,478 |
| 299 | Konstancin-Jeziorna | 16,437 |
| 300 | Lidzbark Warminski | 16,429 |
| 301 | Lapy | 16,323 |
| 302 | Namyslow | 16,265 |
| 303 | Zabkowice Slaskie | 16,210 |
| 304 | Ledziny | 16,194 |
| 305 | Ustka | 16,139 |
| 306 | Staszow | 16,026 |
| 307 | Swidwin | 15,965 |
| 308 | Radzyn Podlaski | 15,960 |
| 309 | Olecko | 15,812 |
| 310 | Garwolin | 15,801 |
| 311 | Przeworsk | 15,694 |
| 312 | Milanowek | 15,673 |
| 313 | Choszczno | 15,622 |
| 314 | Ustron | 15,526 |
| 315 | Nisko | 15,462 |
| 316 | Leczyca | 15,417 |
| 317 | Siemiatycze | 15,310 |
| 318 | Chelmza | 15,292 |
| 319 | Jelcz Laskowice | 15,229 |
| 320 | Lomianki | 15,204 |
| 321 | Jelcz | 15,197 |
| 322 | Ropczyce | 15,168 |
| 323 | Nowy Tomysl | 15,068 |
| 324 | Solec Kujawski | 15,014 |
| 325 | Glucholazy | 15,009 |
| 326 | Glowno | 14,992 |
| 327 | Kartuzy | 14,891 |
| 328 | Cieplice Slaskie Zdroj | 14,889 |
| 329 | Lubsko | 14,883 |
| 330 | Wladyslawowo | 14,778 |
| 331 | Grojec | 14,769 |
| 332 | Lipno | 14,710 |
| 333 | Kepno | 14,702 |
| 334 | Skoczow | 14,699 |
| 335 | Kozle | 14,669 |
| 336 | Czluchow | 14,648 |
| 337 | Morag | 14,634 |
| 338 | Nidzica | 14,609 |
| 339 | Limanowa | 14,603 |
| 340 | Slupca | 14,365 |
| 341 | Wschowa | 14,347 |
| 342 | Ostrzeszow | 14,335 |
| 343 | Darlowo | 14,287 |
| 344 | Barlinek | 14,274 |
| 345 | Chojnow | 14,098 |
| 346 | Wilanow | 13,921 |
| 347 | Pszow | 13,917 |
| 348 | Znin | 13,897 |
| 349 | Lezajsk | 13,847 |
| 350 | Wabrzezno | 13,800 |
| 351 | Grodzisk Wielkopolski | 13,715 |
| 352 | Debno | 13,693 |
| 353 | Goldap | 13,658 |
| 354 | Glubczyce | 13,586 |
| 355 | Wolsztyn | 13,578 |
| 356 | Tuchola | 13,575 |
| 357 | Niedobczyce | 13,389 |
| 358 | Slawno | 13,304 |
| 359 | Zdzieszowice | 13,290 |
| 360 | Koluszki | 13,232 |
| 361 | Zlocieniec | 13,226 |
| 362 | Klobuck | 13,079 |
| 363 | Wlodawa | 13,031 |
| 364 | Rabka-Zdroj | 12,960 |
| 365 | Golub-Dobrzyn | 12,826 |
| 366 | Pyrzyce | 12,782 |
| 367 | Szprotawa | 12,675 |
| 368 | Brzeg Dolny | 12,578 |
| 369 | Gora | 12,557 |
| 370 | Lubaczow | 12,484 |
| 371 | Wegrow | 12,401 |
| 372 | Mogilno | 12,354 |
| 373 | Wolin | 12,327 |
| 374 | Strzelin | 12,283 |
| 375 | Mosina | 12,207 |
| 376 | Brwinow | 12,204 |
| 377 | Aleksandrow Kujawski | 12,179 |
| 378 | Brzeziny | 12,178 |
| 379 | Wolow | 12,165 |
| 380 | Krynica-Zdroj | 12,159 |
| 381 | Paslek | 12,156 |
| 382 | Trzebnica | 12,101 |
| 383 | Blonie | 12,084 |
| 384 | Krosno Odrzanskie | 12,067 |
| 385 | Milicz | 12,058 |
| 386 | Szydlowiec | 12,017 |
| 387 | Mysliborz | 11,981 |
| 388 | Kozy | 11,809 |
| 389 | Wegorzewo | 11,753 |
| 390 | Kowary | 11,723 |
| 391 | Janow Lubelski | 11,700 |
| 392 | Pinczow | 11,695 |
| 393 | Brzeszcze | 11,676 |
| 394 | Miechow | 11,624 |
| 395 | Czarnkow | 11,451 |
| 396 | Nowa Deba | 11,378 |
| 397 | Wronki | 11,351 |
| 398 | Puck | 11,304 |
| 399 | Wisla | 11,268 |
| 400 | Dabrowa Tarnowska | 11,180 |
Population Composition
The median age has increased from 25.9 years in 1950 to 41.1 years in 2018. Projections show that it will be 51 years in 2050.
In 2018, persons in the age group up to 14 years made up 14.80 percent, for the age group 15-24 years 10.34 percent, for the age group 43.44 percent, for the age group 55-64 years 13.95 percent and for the group over 65 years 17, 47 percent.
51.7 percent of the population are women according to the Polish Statistical Office’s yearbook (2018). There are more men than women for all age groups 1–48 years, while there are more women than men in all age groups 49 years and older.
98 percent of the population is ethnically Polish. Ukrainians and Belarusians make up one percent, while the last percent mainly comprises Germans, Jews, Lithuanians and Roma.
The official language is Polish, which is the mother tongue of about 98 percent of the population. The largest linguistic minorities are German, Ukrainian, Belarusian and Kashubian.
Immigration and immigration before World War II
In the Middle Ages, Poland was a free zone for Jews from other countries in Central and Southern Europe.
Immigration of Jews began in the late 11th century and peaked in the 16th century. In the mid-14th century, there were Jewish settlements in at least 35 cities in Poland.
From the middle of the 18th century many Poles emigrated to the Ruhr district, Belgium and France, but also to Switzerland, the United Kingdom, Italy and Turkey. The bulk of the emigration to North and South America took place in the period 1860-1914. It was initially about farmers and workers who then had difficult living conditions in Poland. The largest group of emigrants went to the United States. After World War I, many Polish intellectuals settled in Paris, and in 1919-1920 a large number of Polish miners emigrated to Pas-de-Calais.
In the first half of the 17th century, Polish prisoners of war were sent to Siberia. During the period 1795-1918 deportation of Poles from the part of the country which then belonged to Russia continued. In the city of Irkutsk, a large Polish colony was registered in 1880.
Figures for emigration and deportation before World War II are uncertain, but it is recorded that only in the period 1914-1931 approximately 3.6 million people left Poland.
The population of Poland during World War II
Before World War II, Poland was one of the most mixed European countries. Of a population of about 35 million, Poles made up 24, Ukrainians 5-7, Jews 3.3, Belarusians 1.5 and Lithuanians/Germans about 0.5 million.
Poland was the country in the world that suffered the greatest loss of human life during World War II. About six million people were killed as a result of war, terror and concentration camps. Over 90 percent of the country’s Jewish population was exterminated.
As a result of World War II, Poland lost 180,000 square kilometers of land in the east, now parts of Lithuania, Belarus and Ukraine. In contrast, the western border was shifted to the Oder-Neisse line, while the former Free State of Danzig and an area south of Kaliningrad became part of Poland. This led to displacements, partly by force, of about ten million people.
By the changes of the eastern border in 1945, 1.7 million Poles and 0.5 million Ukrainians and Belarusians were exchanged between Poland and the Soviet Union. In the German territories taken over by Poland in 1944–1845, before the war there were 8.5 million people, predominantly Germans. The majority of the German population fled or were expelled. 2.5 million Poles moved to the area from the central and eastern parts of Poland, and from the Lithuanian/Belarusian and Ukrainian territories that Poland had to relinquish to the Soviet Union. Of the few remaining Germans, a large proportion later left Poland, especially after the 1976 agreement was signed by the country to repatriate the majority of the German-speaking population over the next 10-15 years. But there are still a significant number who feel like Germans in Poland, especially in former Silesia. In 1991, Poland committed itself to respecting minorities linguistic, cultural and religious identity.
Immigration and immigration after World War II
Most of the Jews who survived World War II have emigrated. Thus, during communism, but especially during the years 1956–1957 and 1968–1969, there was an extensive emigration of Polish Jews, especially to the United States and Israel. The result is that today there are just under 10,000 Jews living in Poland.
Since Poland joined the EU and part of the EEA on 1 May 2004, approximately 2.3 million Poles have taken up employment in other EU/EEA countries, most of them in the UK and Ireland. Many of these have emigrated. About Poles in Norway see the article Poland’s relations with Norway.
In total, Polish authorities estimate that between 15 and 18 million Poles/people of Polish descent live abroad. The largest group is in the United States. In Chicago there is a Polish colony of about one million people.
Around 200,000 foreign nationals, mainly from other EU countries, Ukraine and Belarus, are currently working in Poland. Most have not immigrated. In light of Poland’s relatively strong economy, the Polish authorities expect some immigration from countries in southern Europe in the years to come. Following the influx of refugees to Italy and Greece in 2015, the Polish government decided in the autumn of 2015 to accept 5000 of these refugees, see the article Poland’s foreign policy.
Population Patterns
Population density is highest in the industrialized regions in the south and the middle part of the country, lowest in the northeast and northwest. In 2018, the capital Warsaw had 1,764,615 residents. Warsaw is the only Polish city with more than one million residents. Other cities with a population of more than 500,000 in 2018 were: Kraków (767 348), Łódź (690 422), Wrocław (638 586) and Poznan (538 633). In Poland, there are 37 cities with a population of more than 100,000.
60.1 percent of the population lives in urban areas (2018). In only four of the country’s 16 counties, more people live in rural areas than in urban areas. There are the following four counties in the south and southeast: Podkarpackie, ietwietokrzyskie, Lubelskie and Małopolskie.


