Argentina Major Trade Partners
Buying and selling are essential for any country to develop its economy and maintain good relations with other nations. The first table below shows top trading partners of Argentina in terms of export sales (selling), including Brazil, China, and United States. The second lists top trade partners of Argentina regarding import total (buying). That is, most products are imported from these countries to Argentina.
Argentina Major Exports
Market Value: 63,492 (millions) – Last Updated: June, 2024
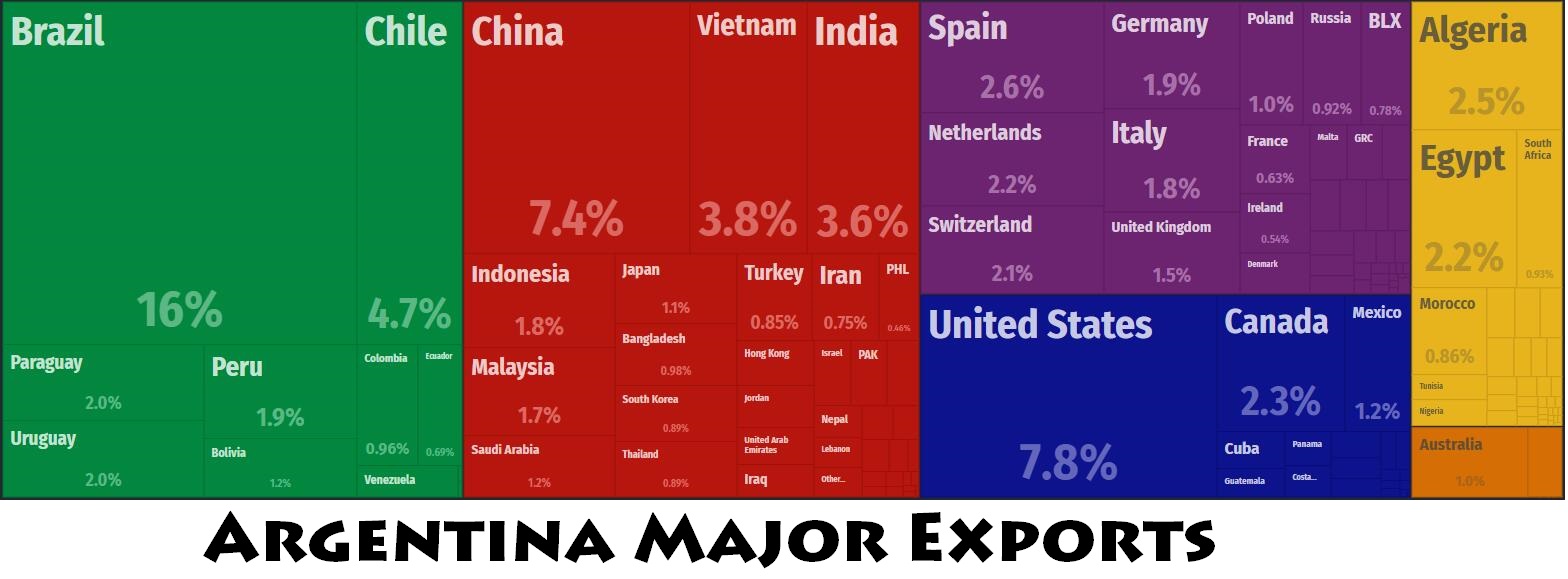
| Rank | Country (Exports To) | Trade Value (thousands) | Share (%) | Growth (% 5yr) |
| 1 | Brazil | 12,987,939 | 20.46 | 139.99 |
| 2 | China | 6,326,788 | 9.96 | 140.52 |
| 3 | United States | 5,253,113 | 8.27 | 41.68 |
| 4 | Chile | 4,390,330 | 6.91 | 14.61 |
| 5 | Netherlands | 2,923,320 | 4.60 | 139.67 |
| 6 | Spain | 2,677,572 | 4.22 | 96.46 |
| 7 | Italy | 1,625,143 | 2.56 | 71.36 |
| 8 | Germany | 1,457,383 | 2.30 | 87.03 |
| 9 | Uruguay | 1,368,770 | 2.16 | 99.13 |
| 10 | Venezuela | 1,287,468 | 2.03 | 198.20 |
| 11 | Mexico | 1,235,117 | 1.95 | 19.65 |
| 12 | Peru | 1,182,256 | 1.86 | 137.48 |
| 13 | Iran | 1,077,738 | 1.70 | 95,407.97 |
| 14 | Egypt | 1,059,849 | 1.67 | 78.46 |
| 15 | South Africa | 976,926 | 1.54 | NA |
| 16 | Russia | 950,703 | 1.50 | 165.79 |
| 17 | Paraguay | 892,573 | 1.41 | 87.00 |
| 18 | Algeria | 884,591 | 1.39 | 97.20 |
| 19 | France | 869,110 | 1.37 | 192.63 |
| 20 | India | 808,300 | 1.27 | 40.48 |
| 21 | United Kingdom | 776,165 | 1.22 | 90.85 |
| 22 | Switzerland | 743,415 | 1.17 | 3,488.28 |
| 23 | Colombia | 712,391 | 1.12 | 160.98 |
| 24 | South Korea | 570,271 | 0.90 | 59.92 |
| 25 | Philippines | 549,550 | 0.87 | 114.59 |
| 26 | Belgium | 509,228 | 0.80 | 103.99 |
| 27 | Turkey | 499,821 | 0.79 | 108.64 |
| 28 | Japan | 492,423 | 0.78 | 21.66 |
| 29 | Morocco | 485,333 | 0.76 | 132.37 |
| 30 | Denmark | 484,696 | 0.76 | 71.82 |
| 31 | Poland | 454,310 | 0.72 | 151.04 |
| 32 | Malaysia | 448,198 | 0.71 | 58.85 |
| 33 | Canada | 436,316 | 0.69 | 147.96 |
| 34 | Saudi Arabia | 432,068 | 0.68 | 148.15 |
| 35 | Indonesia | 397,018 | 0.63 | 69.11 |
| 36 | Ecuador | 384,177 | 0.61 | 97.61 |
Argentina Major Imports
Market Value: 48,707 (millions) – Last Updated: June, 2024
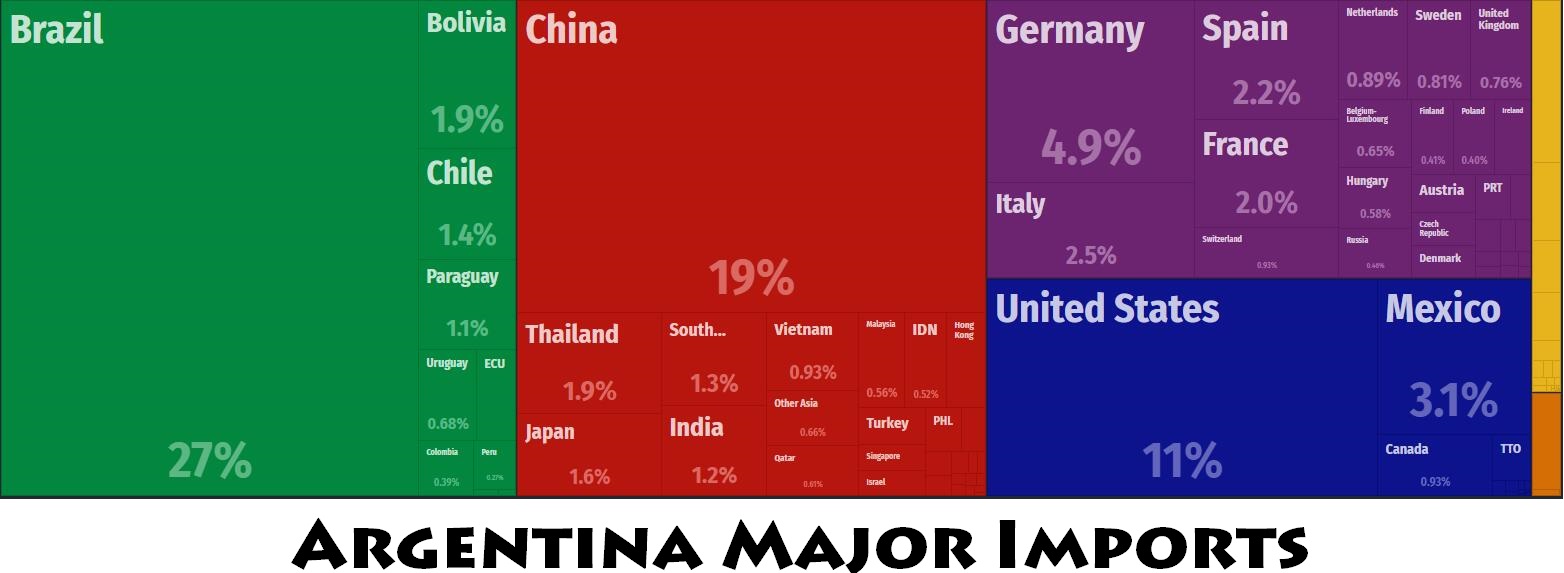
| Rank | Country (Imports From) | Trade Value (thousands) | Share (%) | Growth (% 5yr) |
| 1 | Brazil | 17,552,192 | 36.04 | 132.10 |
| 2 | China | 6,656,007 | 13.67 | 375.11 |
| 3 | United States | 6,611,118 | 13.57 | 92.75 |
| 4 | Germany | 2,229,088 | 4.58 | 104.00 |
| 5 | Mexico | 1,483,421 | 3.05 | 95.74 |
| 6 | Paraguay | 1,447,458 | 2.97 | 280.42 |
| 7 | France | 1,285,709 | 2.64 | 118.96 |
| 8 | Japan | 1,240,417 | 2.55 | (22.99) |
| 9 | Italy | 924,191 | 1.90 | 48.52 |
| 10 | Chile | 837,092 | 1.72 | 107.05 |
| 11 | Spain | 827,236 | 1.70 | 60.23 |
| 12 | Russia | 748,655 | 1.54 | 451.70 |
| 13 | South Korea | 634,410 | 1.30 | 106.48 |
| 14 | Uruguay | 466,378 | 0.96 | 105.82 |
| 15 | Thailand | 420,223 | 0.86 | 223.58 |
| 16 | United Kingdom | 415,542 | 0.85 | 33.53 |
| 17 | India | 375,307 | 0.77 | 132.95 |
| 18 | Malaysia | 349,055 | 0.72 | 166.48 |
| 19 | Trinidad and Tobago | 271,111 | 0.56 | 7,321.17 |
| 20 | Belgium | 231,046 | 0.47 | 65.08 |
| 21 | Canada | 230,377 | 0.47 | 77.54 |
| 22 | Switzerland | 226,245 | 0.46 | (8.91) |
| 23 | Sweden | 216,955 | 0.45 | (18.64) |
| 24 | Indonesia | 187,449 | 0.38 | 74.55 |
| 25 | South Africa | 185,724 | 0.38 | NA |
| 26 | Latvia | 184,927 | 0.38 | 590.98 |
| 27 | Netherlands | 174,393 | 0.36 | 1.29 |
| 28 | Finland | 152,660 | 0.31 | 105.19 |
| 29 | Austria | 134,874 | 0.28 | 53.00 |
| 30 | Ecuador | 131,202 | 0.27 | 140.65 |
| 31 | Singapore | 130,741 | 0.27 | 102.30 |
| 32 | Colombia | 125,871 | 0.26 | 169.02 |
| 33 | Turkey | 123,597 | 0.25 | 380.45 |
| 34 | Egypt | 122,856 | 0.25 | 577.25 |
| 35 | Israel | 115,273 | 0.24 | 99.04 |
| 36 | Denmark | 102,136 | 0.21 | 0.66 |


