Malaysia Population

Malaysia is one of the most developed countries in Southeast Asia. The country is made up of many different ethnicities, religions, languages and cultures.
Key figures and facts
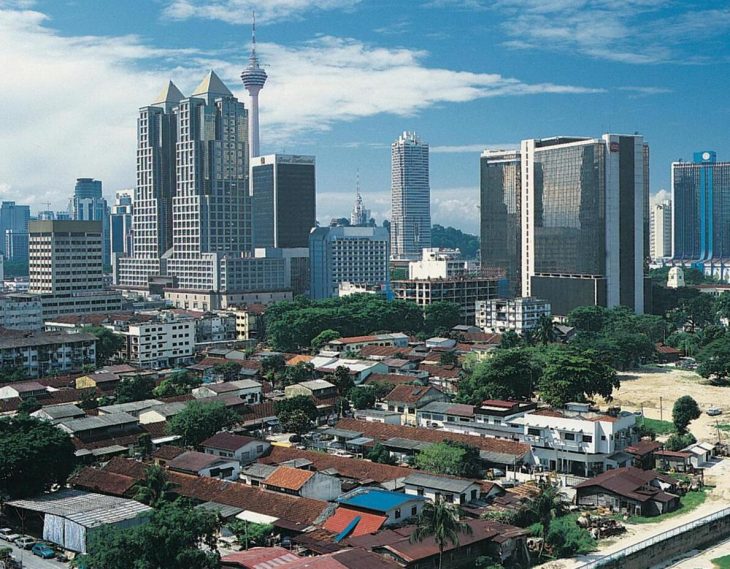
- Capital: Kuala Lumpur
- Ethnic groups: Bumiputera 62% (ethnic Malays and other Indigenous peoples), Chinese 20.6%, Indians 5.7%, other 0.8%, non-nationals 10.3% (2017)
- Language: Bahasa Malay, English, Chinese, Tamil, Telugu, Malayalam, Panjabi, Thai (there are also 112 different origins spoken in Malaysia)
- Religion: Muslims 61.3% (official), Buddhists 19.8%, Christians 9.2%, Hindus 6.3%, Confucianists, Taoists, other traditional Chinese religions 1.3%, other 0.4%, no 0.8 %, unspecified 1% (2010)
- Population: 32 042 458 (2018)
- Control Form: Constitutional monarchy
- Area: 330 800 km2
- Currency: Malaysian ringgit
- GNP per capita: 27 683 PPP $
- National Day: August 31st
Population of Malaysia
Malaysia’s population is estimated at 31,819,660 residents (2018, CIA). The three largest population groups among Malaysian citizens are bumiputera, Chinese and Indians. About 780,000 people are guest workers with foreign nationality. 76 percent of the population lives in cities.
Population of Malaysia by Year (Historical)
| Year | Population | Annual Growth Rate | Population Density | Global Rank |
| 2020 | 32,365,888 | 1.300% | 98.5116 | 45 |
| 2019 | 31,949,666 | 1.340% | 97.2448 | 44 |
| 2018 | 31,527,922 | 1.360% | 95.9611 | 44 |
| 2017 | 31,104,535 | 1.370% | 94.6725 | 44 |
| 2016 | 30,684,543 | 1.370% | 93.3942 | 44 |
| 2015 | 30,270,851 | 1.420% | 92.1350 | 44 |
| 2010 | 28,207,924 | 1.890% | 85.8561 | 44 |
| 2005 | 25,690,500 | 2.070% | 78.1939 | 44 |
| 2000 | 23,194,146 | 2.510% | 70.5958 | 44 |
| 1995 | 20,487,496 | 2.590% | 62.3576 | 45 |
| 1990 | 18,029,713 | 2.940% | 54.8770 | 45 |
| 1985 | 15,598,816 | 2.480% | 47.4781 | 48 |
| 1980 | 13,797,974 | 2.560% | 41.9969 | 49 |
| 1975 | 12,162,076 | 2.400% | 37.0178 | 49 |
| 1970 | 10,804,020 | 2.550% | 32.8843 | 49 |
| 1965 | 9,526,447 | 3.150% | 28.9958 | 51 |
| 1960 | 8,156,236 | 2.990% | 24.8253 | 52 |
| 1955 | 7,038,802 | 2.870% | 21.4242 | 57 |
| 1950 | 6,109,804 | 0.000% | 18.5966 | 58 |
Major Cities in Malaysia by Population
| Rank | City | Population |
| 1 | Kota Bharu | 1,459,883 |
| 2 | Kuala Lumpur | 1,453,864 |
| 3 | Klang | 879,756 |
| 4 | Kampung Baru Subang | 833,460 |
| 5 | Johor Bahru | 802,378 |
| 6 | Subang Jaya | 708,185 |
| 7 | Ipoh | 673,207 |
| 8 | Kuching | 570,296 |
| 9 | Petaling Jaya | 520,587 |
| 10 | Shah Alam | 481,543 |
| 11 | Kota Kinabalu | 457,215 |
| 12 | Sandakan | 392,177 |
| 13 | Seremban | 372,806 |
| 14 | Kuantan | 366,118 |
| 15 | Tawau | 306,351 |
| 16 | George Town | 299,889 |
| 17 | Kuala Terengganu | 284,954 |
| 18 | Sungai Petani | 228,732 |
| 19 | Miri | 228,101 |
| 20 | Taiping | 217,536 |
| 21 | Alor Setar | 217,257 |
| 22 | Bukit Mertajam | 212,218 |
| 23 | Sepang | 211,939 |
| 24 | Sibu | 198,128 |
| 25 | Malacca | 180,560 |
| 26 | Kulim | 170,778 |
| 27 | Kluang | 169,717 |
| 28 | Skudai | 159,622 |
| 29 | Batu Pahat | 156,125 |
| 30 | Bintulu | 151,506 |
| 31 | Kampung Pasir Gudang Baru | 145,528 |
| 32 | Kampung Sungai Ara | 140,738 |
| 33 | Tasek Glugor | 135,675 |
| 34 | Muar | 127,786 |
| 35 | Rawang | 120,336 |
| 36 | Butterworth | 107,480 |
| 37 | Lahad Datu | 105,511 |
| 38 | Semenyih | 92,380 |
| 39 | Port Dickson | 89,087 |
| 40 | Cukai | 82,314 |
| 41 | Putatan | 78,229 |
| 42 | Keningau | 77,539 |
| 43 | Ulu Tiram | 75,239 |
| 44 | Victoria | 73,542 |
| 45 | Taman Senai | 73,065 |
| 46 | Donggongon | 71,474 |
| 47 | Segamat | 69,705 |
| 48 | Kampong Baharu Balakong | 69,191 |
| 49 | Perai | 65,190 |
| 50 | Kangar | 63,758 |
| 51 | Kulai | 63,651 |
| 52 | Jitra | 63,378 |
| 53 | Teluk Intan | 63,242 |
| 54 | Semporna | 62,530 |
| 55 | Putra Heights | 59,889 |
| 56 | Temerluh | 59,805 |
| 57 | Kampong Dungun | 58,563 |
| 58 | Simpang Empat | 57,893 |
| 59 | Kuala Selangor | 55,776 |
| 60 | Kampung Bukit Baharu | 55,545 |
| 61 | Bandar Labuan | 54,641 |
| 62 | Kota Tinggi | 52,632 |
| 63 | Pontian Kechil | 50,725 |
| 64 | Putrajaya | 49,889 |
| 65 | Bentong Town | 49,102 |
| 66 | Banting | 48,129 |
| 67 | Bedong | 47,474 |
| 68 | Batu Gajah | 46,072 |
| 69 | Mentekab | 42,060 |
| 70 | Nibong Tebal | 39,961 |
| 71 | Raub | 39,913 |
| 72 | Kampong Pangkal Kalong | 39,793 |
| 73 | Lumut | 39,484 |
| 74 | Kuala Kangsar | 39,220 |
| 75 | Klebang Besar | 38,532 |
| 76 | Kampung Ayer Keroh | 37,605 |
| 77 | Kampung Baharu Nilai | 36,609 |
| 78 | Tangkak | 34,998 |
| 79 | Jerantut | 33,495 |
| 80 | Kudat | 32,282 |
| 81 | Pekan | 31,715 |
| 82 | Bahau | 31,162 |
| 83 | Bakri | 30,169 |
| 84 | Kuah | 30,101 |
| 85 | Bidur | 29,905 |
| 86 | Sarikei | 29,170 |
| 87 | Kampong Masjid Tanah | 29,074 |
| 88 | Tanah Merah | 29,005 |
| 89 | Serendah | 28,373 |
| 90 | Tampin | 28,127 |
| 91 | Tapah Road | 27,752 |
| 92 | Parit Buntar | 27,202 |
| 93 | Simanggang | 27,096 |
| 94 | Permatang Kuching | 27,080 |
| 95 | Yong Peng | 27,027 |
| 96 | Sungai Besar | 26,828 |
| 97 | Limbang | 26,088 |
| 98 | Sungai Udang | 25,933 |
| 99 | Batu Berendam | 24,917 |
| 100 | Jenjarum | 24,746 |
| 101 | Kertih | 24,290 |
| 102 | Tanjung Tokong | 23,960 |
| 103 | Ladang Seri Kundang | 23,196 |
| 104 | Pekan Nenas | 23,181 |
| 105 | Peringat | 23,177 |
| 106 | Batu Arang | 22,468 |
| 107 | Tanjung Sepat | 22,229 |
| 108 | Mersing | 21,896 |
| 109 | Labis | 21,795 |
| 110 | Marang | 21,299 |
| 111 | Kuang | 21,074 |
| 112 | Paka | 20,933 |
| 113 | Bagan Serai | 20,365 |
| 114 | Alor Gajah | 20,052 |
| 115 | Batang Berjuntai | 19,890 |
| 116 | Batu Feringgi | 19,889 |
| 117 | Pelabuhan Klang | 19,889 |
| 118 | Gua Musang | 19,620 |
| 119 | Kuala Pilah | 19,399 |
| 120 | Ranau | 19,183 |
| 121 | Papar | 19,167 |
| 122 | Kampong Kadok | 19,122 |
| 123 | Kuala Kedah | 19,120 |
| 124 | Kampar | 18,945 |
| 125 | Pasir Mas | 18,906 |
| 126 | Kampung Simpang Renggam | 17,417 |
| 127 | Parit Raja | 17,330 |
| 128 | Bukit Rambai | 17,280 |
| 129 | Sabak Bernam | 17,140 |
| 130 | Kepala Batas | 17,020 |
| 131 | Kampung Tanjung Karang | 16,282 |
| 132 | Pantai Remis | 16,206 |
| 133 | Gurun | 15,853 |
| 134 | Beaufort | 15,744 |
| 135 | Kapit | 15,660 |
| 136 | Kinarut | 15,605 |
| 137 | Kampung Ayer Molek | 15,386 |
| 138 | Kuala Lipis | 15,337 |
| 139 | Pantai Cenang | 14,889 |
| 140 | Bemban | 14,218 |
| 141 | Kuala Perlis | 13,806 |
| 142 | Sungai Pelek New Village | 13,718 |
| 143 | Jertih | 13,415 |
| 144 | Kelapa Sawit | 13,128 |
| 145 | Buloh Kasap | 12,977 |
| 146 | Kota Belud | 12,714 |
| 147 | Kampung Bukit Tinggi, Bentong | 12,235 |
| 148 | Tumpat | 12,169 |
| 149 | Kuala Sungai Baru | 12,158 |
| 150 | Juru | 12,154 |
| 151 | Pulau Sebang | 11,768 |
| 152 | Chaah | 11,733 |
| 153 | Taman Rajawali | 9,889 |
| 154 | Telaga Batu | 9,889 |
| 155 | Ayer Hangat | 9,889 |
| 156 | Padang Mat Sirat | 9,889 |
| 157 | Tanah Rata | 6,889 |
Population growth and composition
In 2018, the population increased by 1.34 percent. The birth and death rates per 1000 residents are 18.8 and 5.2 respectively. Both birth and death rates have dropped significantly since the 1950s. The birth profile was in 1955 at 44 and the death profile at 18.0. The birth rate per woman is 2.48. Net immigration is minus 0.3 per milliliter. The average life expectancy at birth is 78.4 years for women and 72.6 years for men (2018).
The proportion of the population under the age of 15 has been declining since 2005, while the proportion of working age 15-64 years and the proportion of people over 65 have been increasing. In 2018, these figures were 24.78 percent, 66.35 percent and 6.35 percent, respectively.
Ethnic conditions
The population is ethnically very composed, and there have been several conflicts between the various groups. The most serious riots occurred in 1969, and the authorities subsequently introduced new guidelines whereby the indigenous peoples were given benefits over the newly arrived Chinese and Indians.
The ethnic distribution among the three largest Malaysian nationals in 2018 is as follows:
- 62 percent bumiputera
- 6 percent of Chinese
- 7 percent Indians
Bumiputera, which means ‘sons of the earth’, is a collective term for the original population. First and foremost, bumiputera includes Muslim Malays. The Malay also includes closely related groups who immigrated in the late 1800s. The remaining peoples of the bumiputera group include indigenous orang asli in the Malayan Peninsula and a variety of peoples in Sarawak and Sabah.
The Chinese began to immigrate in the early 1800s. They were mostly traders, craftsmen or workers in the tin mines, and most of them settled in cities. A small group of Chinese have lived in Melaka since 1405 and are known as Baba-Chinese or Peranakans. The Chinese population has a much lower growth rate than the Malays, so their share of the population is declining.
Almost all of the country’s Indians reside in the Malaysian part of the Malay Peninsula, also known as Western Malaysia. Most are Tamils, who were brought in by the United Kingdom between the 1890s and 1930s to work on the rubber plantations, in the tin mines or at the railroad.
Malaysia has had a shortage of labor in modern times as well. In 2017, there were 1,781,598 registered foreign nationals guest workers in Malaysia. The five countries with the highest number of guest workers in Malaysia were:
- Indonesia(720 870)
- Nepal(405 898)
- Bangladesh (221 089)
- Myanmar(127,705)
- India(114,455)
However, a large number of workers are illegal in Malaysia at all times.
The Malaysian part of the Malay Peninsula
The Malays have the highest population growth rate and make up the majority of the rural population, and they dominate the east coast. The traditional settlement form is in villages (kampong), which are usually located on a river bank or on the coast. Gradually, the Malay became prominent in the cities of the west coast, especially in the public administration.
The indigenous population of orang asli consists of a total of 18 groups. These are often divided into three main groups:
- Agta is the oldest population and lives in the mountainous regions of the states of Kelantan, Perak, Pahang and Terengganu.
- Senoi (or sakai) arrived later than eight and lives in the states of the east coast as well as Perak and Selangor.
- The Proto-Malay lives mainly in the far south.
The Chinese live almost exclusively in the larger cities of the states of the west coast, and they are strongly applicable in trade and industry.
Sarawak and Sabah
In Sarawak and Sabah, the population composition is more complicated. In these states, the term bumiputera includes partly Malay and partly various local people groups. The Malays, for their part, include people who have immigrated and partly local people who have converted to Islam and who have been assimilated. The six largest ethnic groups are:
- iban(formerly called sea jayaker)
- Chinese
- Malays
- bidayuh (formerly called landjaker)
- Melanau
- orang ulu
The population of Sarawak also includes more than 150,000 foreign nationals, mainly Indonesian guest workers (2015).
In Sabah, the population has had a very high growth rate for many years. This is due to both a high natural growth rate and immigration. Statistics from 2018 show that almost one-third of Sabah’s population is foreign nationals, mainly guest workers from Indonesia and the Philippines and illegal immigration from these two countries. The three largest ethnic groups are the kadazan dusun people, bajau and malay.
Settlement
The cities grow very quickly at the expense of the countryside. From 1980 to 2018, the proportion of people living in urban areas increased from 33 percent to 76 percent. All the eight largest cities are located in the western part of Western Malaysia. The four largest cities are:
- Kuala Lumpur (7.2 million people)
- George Town (2,412,616 residents)
- Ipoh (737,861 residents)
- Johor Bahru (497 067 residents)


