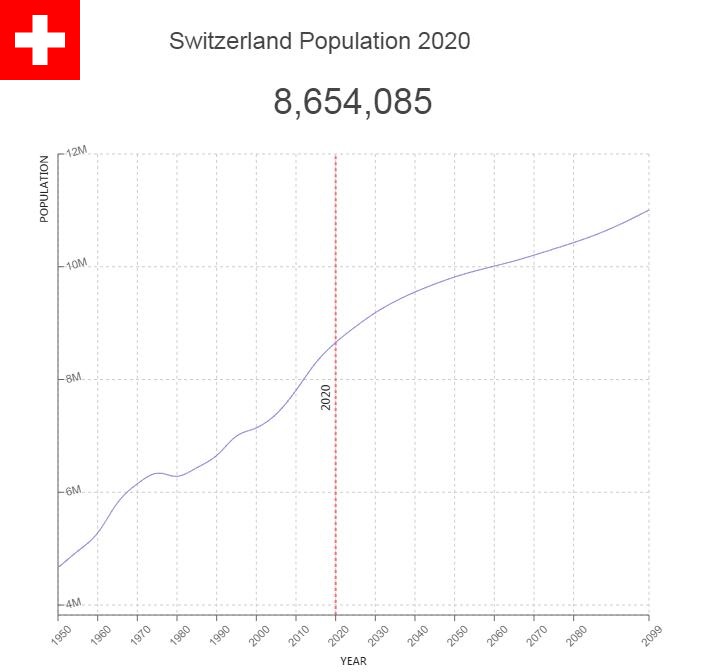
Switzerland Population
Switzerland is one of the richest countries in the world and has a form of direct democracy with frequent referendums. The political system and the good economy have made Switzerland one of the most stable countries in the world.
Key figures and facts
- Capital: Bern
- Ethnic groups: Swiss 70.3%, German 4.2% Italian 3.2%, Portuguese 2.6%, French 2%, Kosovo 1%, other 18.7% (2017)
- Language: German (official) 62.8%, French (official) 22.9%, Italian (official) 8.2%, English 5.1%, Portuguese 3.7%, Albanian 3.1%, Serbo-Croatian 2.4%, Spanish 2.3%, Rhetoric (official) 0.5 %, other 7.5%. (2016)
- Religion: Catholics 36.5%, Protestants 24.5%, other Christians 5.9%, Muslims 5.2%, others 1.4%, Jewish 0.3%, none 24.9%, unspecified 1.3% (2016)
- Population: 8 544 034
- Control Form: Republic
- Area: 41 285 km2
- Currency: Swiss Franc
- GNP per capita: 63 889 PPP $
- National Day: August 1st
Switzerland Population
Switzerland’s population in the 1950s and 1960s showed an average annual growth of 1.4 percent. This relatively strong growth was largely due to immigration, and in 1960-70 immigration accounted for 40 percent of the total population growth in the country. With the economic downturn of 1973-74, the traditional immigration surplus was replaced by a significant net outflow, and in 1970-80 as a whole, the average annual growth in the country’s population was only 0.15 percent. From the 1980s, population growth has again shown an increase; Growth averaged 0.6 percent annually in 1980-90 and 1.1 percent in the ten-year period 2008-2018.

Growth in Switzerland’s population in the 1980s was divided by 40 percent on natural growth (birth surplus) and 60 percent on net immigration. The proportion of birth surpluses increased to 48 percent in the 1990s, but has dropped significantly since the turn of the millennium; the share thus amounted to only 15 percent in the ten-year period 2007–16. This is primarily due to a very strong increase in net immigration, a development we know from most Western European countries, including Norway.
The increase in net immigration is also reflected in the proportion of foreign nationals constituting the country’s total population growth, as well as in their share of the country’s total population. Thus, in the 1990s, the growth in the number of Swiss nationals accounted for just over 1/3 of the country’s total annual population growth, while their share of the Swiss population in 1990 was 84.0 percent. Up to 2000, their share of the country’s population dropped to 80.4 percent, and in 2017, Swiss nationals made up 74.9 percent of the country’s total population.
In 2017, Switzerland had more than 2.1 million residents with foreign nationality. The largest single countries measured by their share of foreign nationals residing in Switzerland are (percent 2017): Italy (15.1) Germany (14.5), Portugal (12.8), France (6.0), Kosovo (5), 2), Spain (4.0), Serbia (3.3), Turkey (3.3), Macedonia (3.1) and Austria (2.0). Of the foreign nationals residing in Switzerland in 2017, a total of 66 percent came from EU/EFTA countries and 18 percent from Europe in general.
Increasing life expectancy and a steadily declining birth surplus have led to over 65 years of age constituting an ever larger proportion of the population; the group accounted for 18.3 percent in 2017. At the same time, the share for the group is under 20; In 2017, this group accounted for 20.0 percent.
The total fertility rate (the average number of children a woman gets to live her entire fertile age (15-49 years), and based on the birth rates at each age step in the current year) was between 1.52 (2010)) and 1.55 (2016). The average life expectancy at birth was 2016 in Switzerland at 81.5 years for men and 85.3 years for women. The differences in life expectancy between the sexes have been reduced in Switzerland, as in most western countries, including Norway, in the last decades. The difference was 3.8 years in 2016, for example 5.7 years in 2001 and 6.8 years in 1981.
In 2017, the average population density for the entire country was 204 residents per km². The large mountain areas contribute to a geographically very uneven population density, giving Switzerland as a whole a lower population density than the other Central European countries. Clearly the closest is the settlement in Mittelland. The thinnest poplar canton (Graubünden) has only 28 people per km².
Village building is the most common form of settlement in the countryside, usually the villages are small, and most villages form their own municipalities. In some cantons, such as Appenzell and Jura, single farms are common.
In 2017, the five largest cities (Zurich, Basel, Geneva, Bern and Lausanne) had only 12.4 percent of the country’s population. This is a result of the special municipal structure in Switzerland with, among other things, very narrow boundaries for the cities. With the suburbs, that is, in the agglomerations (towns) that these five cities form, the population that year constituted 39.4 percent of Switzerland’s population.
In total, 77.4 percent of Switzerland’s population in 2017 lived in ” urban areas”, which in Norway roughly corresponds to urban areas with more than approximately 10,000 residents.
Population of Switzerland by Year (Historical)
| Year | Population | Annual Growth Rate | Population Density | Global Rank |
| 2020 | 8,654,511 | 0.740% | 219.0156 | 101 |
| 2019 | 8,591,254 | 0.770% | 217.4148 | 100 |
| 2018 | 8,525,500 | 0.830% | 215.7509 | 100 |
| 2017 | 8,455,693 | 0.910% | 213.9843 | 99 |
| 2016 | 8,379,806 | 1.000% | 212.0639 | 99 |
| 2015 | 8,296,664 | 1.220% | 209.9599 | 99 |
| 2010 | 7,808,564 | 1.120% | 197.6079 | 97 |
| 2005 | 7,386,705 | 0.670% | 186.9323 | 96 |
| 2000 | 7,143,650 | 0.420% | 180.7815 | 93 |
| 1995 | 6,995,410 | 1.010% | 177.0301 | 92 |
| 1990 | 6,652,757 | 0.670% | 168.3588 | 91 |
| 1985 | 6,435,313 | 0.480% | 162.8562 | 88 |
| 1980 | 6,283,721 | -0.170% | 159.0199 | 81 |
| 1975 | 6,336,914 | 0.600% | 160.3661 | 78 |
| 1970 | 6,150,741 | 1.140% | 155.6547 | 72 |
| 1965 | 5,812,740 | 1.940% | 147.1012 | 68 |
| 1960 | 5,280,569 | 1.270% | 133.6340 | 70 |
| 1955 | 4,956,955 | 1.210% | 125.4445 | 71 |
| 1950 | 4,667,975 | 0.000% | 118.1315 | 68 |
Major Cities in Switzerland by Population
| Rank | City | Population |
| 1 | Zurich | 341,619 |
| 2 | Geneve | 183,870 |
| 3 | Basel | 164,377 |
| 4 | Bern | 121,520 |
| 5 | Lausanne | 116,640 |
| 6 | Winterthur | 91,797 |
| 7 | Sankt Gallen | 70,461 |
| 8 | Lugano | 62,889 |
| 9 | Luzern | 56,955 |
| 10 | Zuerich (Kreis 11) | 54,149 |
| 11 | Biel/Bienne | 48,503 |
| 12 | Zuerich (Kreis 3) | 45,907 |
| 13 | Zuerich (Kreis 9) | 44,767 |
| 14 | Thun | 42,025 |
| 15 | Koniz | 37,085 |
| 16 | La Chaux-de-Fonds | 36,714 |
| 17 | Zuerich (Kreis 10) | 36,105 |
| 18 | Rapperswil | 34,665 |
| 19 | Schaffhausen | 33,752 |
| 20 | Zuerich (Kreis 7) | 33,709 |
| 21 | Fribourg | 32,716 |
| 22 | Chur | 32,318 |
| 23 | Neuchatel | 31,159 |
| 24 | Vernier | 29,975 |
| 25 | Zuerich (Kreis 6) | 29,840 |
| 26 | Zuerich (Kreis 2) | 29,104 |
| 27 | Zuerich (Kreis 9) / Altstetten | 28,196 |
| 28 | Zuerich (Kreis 12) | 28,078 |
| 29 | Sitten | 27,934 |
| 30 | Lancy | 27,180 |
| 31 | Zuerich (Kreis 4) / Aussersihl | 27,162 |
| 32 | Emmen | 26,778 |
| 33 | Kriens | 24,899 |
| 34 | Yverdon-les-Bains | 23,591 |
| 35 | Zug | 23,324 |
| 36 | Uster | 23,168 |
| 37 | Montreux | 22,786 |
| 38 | Frauenfeld | 21,868 |
| 39 | Zuerich (Kreis 3) / Sihlfeld | 20,866 |
| 40 | Dietikon | 20,782 |
| 41 | Baar | 20,435 |
| 42 | Zuerich (Kreis 6) / Unterstrass | 19,934 |
| 43 | Riehen | 19,889 |
| 44 | Dubendorf | 19,771 |
| 45 | Meyrin | 19,661 |
| 46 | Carouge | 19,233 |
| 47 | Wettingen | 18,080 |
| 48 | Allschwil | 18,078 |
| 49 | Zuerich (Kreis 11) / Oerlikon | 17,811 |
| 50 | Zuerich (Kreis 11) / Seebach | 17,740 |
| 51 | Renens | 17,700 |
| 52 | Jona | 17,544 |
| 53 | Kreuzlingen | 17,544 |
| 54 | Onex | 17,191 |
| 55 | Zuerich (Kreis 11) / Affoltern | 17,130 |
| 56 | Zuerich (Kreis 10) / Hoengg | 17,006 |
| 57 | Gossau | 16,932 |
| 58 | Muttenz | 16,816 |
| 59 | Wil | 16,697 |
| 60 | Nyon | 16,686 |
| 61 | Bellinzona | 16,461 |
| 62 | Zuerich (Kreis 9) / Albisrieden | 16,369 |
| 63 | Olten | 16,300 |
| 64 | Oberwinterthur (Kreis 2) | 16,245 |
| 65 | Kloten | 16,178 |
| 66 | Pully | 16,152 |
| 67 | Stadt Winterthur (Kreis 1) | 16,071 |
| 68 | Littau | 16,010 |
| 69 | Baden | 16,007 |
| 70 | Zuerich (Kreis 2) / Wollishofen | 15,962 |
| 71 | Horgen | 15,862 |
| 72 | Grenchen | 15,816 |
| 73 | Vevey | 15,701 |
| 74 | Sierre | 15,641 |
| 75 | Zuerich (Kreis 10) / Wipkingen | 15,607 |
| 76 | Zuerich (Kreis 8) | 15,408 |
| 77 | Aarau | 15,390 |
| 78 | Herisau | 15,327 |
| 79 | Seen (Kreis 3) | 15,323 |
| 80 | Adliswil | 15,119 |
| 81 | Steffisburg | 15,080 |
| 82 | Monthey | 14,995 |
| 83 | Zuerich (Kreis 3) / Alt-Wiedikon | 14,820 |
| 84 | Pratteln | 14,766 |
| 85 | Solothurn | 14,742 |
| 86 | Burgdorf | 14,677 |
| 87 | Martigny-Ville | 14,657 |
| 88 | Locarno | 14,398 |
| 89 | Freienbach | 14,191 |
| 90 | Langenthal | 14,073 |
| 91 | Schwyz | 14,066 |
| 92 | Binningen | 14,019 |
| 93 | Morges | 14,006 |
| 94 | Wohlen | 13,764 |
| 95 | Cham | 13,384 |
| 96 | Thalwil | 13,185 |
| 97 | Waedenswil | 13,158 |
| 98 | Bulach | 13,061 |
| 99 | Einsiedeln | 13,037 |
| 100 | Thonex | 12,946 |
| 101 | Zuerich (Kreis 4) / Hard | 12,865 |
| 102 | Wetzikon | 12,858 |
| 103 | Arbon | 12,822 |
| 104 | Liestal | 12,721 |
| 105 | Schlieren | 12,584 |
| 106 | Wuelflingen (Kreis 6) | 12,487 |
| 107 | Spiez | 12,483 |
| 108 | Muri | 12,263 |
| 109 | Horw | 12,237 |
| 110 | Uzwil | 12,000 |
| 111 | Bulle | 11,984 |
| 112 | Kussnacht | 11,666 |
| 113 | Zuerich (Kreis 5) | 11,626 |
| 114 | Wallisellen | 11,594 |
| 115 | Munchenstein | 11,533 |
| 116 | Kuesnacht | 11,414 |
| 117 | Ebikon | 11,360 |
| 118 | Versoix | 11,356 |
| 119 | Zofingen | 11,340 |
| 120 | Amriswil | 11,240 |
| 121 | Zuerich (Kreis 12) / Hirzenbach | 11,224 |
| 122 | Delemont | 11,204 |
| 123 | Worb | 10,942 |
| 124 | Mattenbach (Kreis 7) | 10,932 |
| 125 | Davos | 10,913 |
| 126 | Lyss | 10,826 |
| 127 | Munsingen | 10,817 |
| 128 | Rheinfelden | 10,622 |
| 129 | Gland | 10,530 |
| 130 | Altstatten | 10,463 |
| 131 | Spreitenbach | 10,451 |
| 132 | Plan-les-Ouates | 10,429 |
| 133 | Prilly | 10,413 |
| 134 | La Tour-de-Peilz | 10,411 |
| 135 | Chene-Bougeries | 10,376 |
| 136 | Zuerich (Kreis 12) / Schwamendingen-Mitte | 10,365 |
| 137 | Rotkreuz | 10,328 |
| 138 | Uster / Kirch-Uster | 10,317 |
| 139 | Buchs | 10,307 |
| 140 | Oftringen | 10,279 |
| 141 | Zuerich (Kreis 4) / Langstrasse | 10,275 |
| 142 | Le Locle | 10,168 |
| 143 | Ecublens | 10,151 |
| 144 | Birsfelden | 10,121 |
| 145 | Richterswil | 10,078 |
| 146 | Oberwil | 10,076 |
| 147 | Aesch | 10,027 |
| 148 | Effretikon | 10,008 |
| 149 | Ecublens | 9,954 |
| 150 | Villars-sur-Glane | 9,910 |
| 151 | Neuhausen | 9,908 |
| 152 | Zuerich (Kreis 7) / Hottingen | 9,823 |
| 153 | Zuerich (Kreis 3) / Friesenberg | 9,798 |
| 154 | Zuerich (Kreis 6) / Oberstrass | 9,795 |
| 155 | Zuerich (Kreis 5) / Gewerbeschule | 9,780 |
| 156 | Arth | 9,739 |
| 157 | Munchenbuchsee | 9,690 |
| 158 | Veyrier | 9,689 |
| 159 | Le Grand-Saconnex | 9,670 |
| 160 | Bernex | 9,648 |
| 161 | Flawil | 9,628 |
| 162 | Therwil | 9,484 |
| 163 | Rueti | 9,465 |
| 164 | Weinfelden | 9,303 |
| 165 | Sarnen | 9,299 |
| 166 | Mohlin | 9,271 |
| 167 | Suhr | 9,263 |
| 168 | Belp | 9,196 |
| 169 | Arlesheim | 9,190 |
| 170 | Colombier | 9,186 |
| 171 | Zuchwil | 9,157 |
| 172 | Ober Urdorf | 9,094 |
| 173 | Gstaad | 9,089 |
| 174 | Brugg | 9,085 |
| 175 | Eschenbach | 9,064 |
| 176 | Wohlen | 9,048 |
| 177 | Zollikofen | 9,010 |
| 178 | Zuerich (Kreis 7) / Witikon | 8,988 |
| 179 | Goldach | 8,983 |
| 180 | Hunenberg | 8,921 |
| 181 | Rorschach | 8,889 |
| 182 | Romanshorn | 8,845 |
| 183 | Affoltern am Albis | 8,817 |
| 184 | Veltheim | 8,790 |
| 185 | Langnau | 8,673 |
| 186 | Lutry | 8,663 |
| 187 | Altdorf | 8,567 |
| 188 | Toss | 8,561 |
| 189 | Wittenbach | 8,431 |
| 190 | Steinhausen | 8,398 |
| 191 | Zuerich (Kreis 2) / Enge | 8,142 |
| 192 | Hochdorf | 8,081 |
| 193 | Kirchberg | 8,016 |
| 194 | Wattwil | 7,978 |
| 195 | Chiasso | 7,949 |
| 196 | Sursee | 7,903 |
| 197 | Pfaffikon | 7,883 |
| 198 | Obersiggenthal | 7,879 |
| 199 | Unterageri | 7,862 |
| 200 | Ingenbohl | 7,856 |
| 201 | Hegnau | 7,850 |
| 202 | Chene-Bourg | 7,848 |
| 203 | Neuenhof | 7,846 |
| 204 | Maennedorf | 7,840 |
| 205 | Biberist | 7,778 |
| 206 | Reinach | 7,734 |
| 207 | Giubiasco | 7,641 |
| 208 | Schubelbach | 7,634 |
| 209 | Aigle | 7,612 |
| 210 | Moutier | 7,610 |
| 211 | Epalinges | 7,595 |
| 212 | Oberriet | 7,564 |
| 213 | Payerne | 7,544 |
| 214 | Marly | 7,542 |
| 215 | Aadorf | 7,509 |
| 216 | Oberentfelden | 7,442 |
| 217 | Naters | 7,441 |
| 218 | Pregassona | 7,437 |
| 219 | Regensdorf | 7,420 |
| 220 | Stans | 7,364 |
| 221 | Rothrist | 7,312 |
| 222 | Bussigny | 7,297 |
| 223 | Lenzburg | 7,281 |
| 224 | Lengnau | 7,225 |
| 225 | Mendrisio | 7,199 |
| 226 | Pfaeffikon | 7,199 |
| 227 | Dudingen | 7,044 |
| 228 | Siebnen | 6,993 |
| 229 | Embrach | 6,977 |
| 230 | Bassersdorf | 6,899 |
| 231 | Zuerich (Kreis 7) / Fluntern | 6,898 |
| 232 | Langnau am Albis | 6,889 |
| 233 | Wollerau | 6,772 |
| 234 | Thalwil / Dorfkern | 6,718 |
| 235 | Aarburg | 6,717 |
| 236 | Igis | 6,717 |
| 237 | Domat | 6,706 |
| 238 | Zuerich (Kreis 7) / Hirslanden | 6,658 |
| 239 | Nidau | 6,585 |
| 240 | Windisch | 6,578 |
| 241 | Lachen | 6,574 |
| 242 | Au | 6,562 |
| 243 | Frutigen | 6,560 |
| 244 | Ollon | 6,554 |
| 245 | Minusio | 6,542 |
| 246 | Conthey | 6,523 |
| 247 | Zermatt | 6,518 |
| 248 | Bagnes | 6,515 |
| 249 | Saanen | 6,510 |
| 250 | Crissier | 6,501 |
| 251 | Buchs | 6,488 |
| 252 | Visp | 6,465 |
| 253 | Graenichen | 6,446 |
| 254 | Bremgarten | 6,432 |
| 255 | Meggen | 6,422 |
| 256 | Porrentruy | 6,410 |
| 257 | Blecherette | 6,405 |
| 258 | Kilchberg | 6,400 |
| 259 | Muri | 6,352 |
| 260 | Sirnach | 6,352 |
| 261 | Dornach | 6,338 |
| 262 | Thal | 6,322 |
| 263 | Ruswil | 6,321 |
| 264 | Grabs | 6,273 |
| 265 | Viganello | 6,264 |
| 266 | Untersiggenthal | 6,233 |
| 267 | Trimbach | 6,109 |
| 268 | Zuerich (Kreis 1) | 6,074 |
| 269 | Malters | 6,070 |
| 270 | Frenkendorf | 6,069 |
| 271 | Dietlikon / Dietlikon (Dorf) | 6,038 |
| 272 | Horgen / Horgen (Dorfkern) | 6,029 |
| 273 | Derendingen | 5,982 |
| 274 | Bolligen | 5,975 |
| 275 | Losone | 5,959 |
| 276 | Neuenkirch | 5,852 |
| 277 | Bex | 5,845 |
| 278 | Mattenbach (Kreis 7) / Deutweg | 5,819 |
| 279 | Collombey | 5,815 |
| 280 | Fully | 5,811 |
| 281 | Bottmingen | 5,801 |
| 282 | Biasca | 5,774 |
| 283 | Sissach | 5,762 |
| 284 | Balsthal | 5,752 |
| 285 | Zollikon | 5,701 |
| 286 | Oberengstringen | 5,694 |
| 287 | Murten/Morat | 5,689 |
| 288 | Massagno | 5,663 |
| 289 | Stafa | 5,626 |
| 290 | Les Avanchets | 5,619 |
| 291 | Peseux | 5,605 |
| 292 | Gelterkinden | 5,598 |
| 293 | Teufen | 5,572 |
| 294 | Glarus | 5,570 |
| 295 | Uetendorf | 5,543 |
| 296 | Appenzell | 5,538 |
| 297 | Oberuzwil | 5,505 |
| 298 | Pfaeffikon / Pfaeffikon (Dorfkern) | 5,484 |
| 299 | Adligenswil | 5,465 |
| 300 | Saviese | 5,464 |
| 301 | Zuerich (Kreis 8) / Muehlebach | 5,459 |
| 302 | Uznach | 5,450 |
| 303 | Buochs | 5,413 |
| 304 | Herzogenbuchsee | 5,411 |
| 305 | Heimberg | 5,390 |
| 306 | Wurenlos | 5,386 |
| 307 | Villmergen | 5,378 |
| 308 | Hinwil | 5,377 |
| 309 | Chavannes | 5,343 |
| 310 | Hergiswil | 5,326 |
| 311 | Menziken | 5,304 |
| 312 | Basse-Nendaz | 5,299 |
| 313 | Diepoldsau | 5,290 |
| 314 | Sankt Margrethen | 5,284 |
| 315 | Oberwinterthur (Kreis 2) / Guggenbuehl | 5,265 |
| 316 | Oberwinterthur (Kreis 2) / Talacker | 5,264 |
| 317 | Buchrain | 5,230 |
| 318 | Kirchberg | 5,224 |
| 319 | Goldau | 5,174 |
| 320 | Altendorf | 5,169 |
| 321 | Le Mont-sur-Lausanne | 5,159 |
| 322 | Urtenen | 5,147 |
| 323 | Blonay | 5,133 |
| 324 | Kuttigen | 5,123 |
| 325 | Saint-Imier | 5,109 |
| 326 | Alpnach | 5,107 |
| 327 | Kerns | 5,106 |
| 328 | Laufen | 5,099 |
| 329 | Zuerich (Kreis 12) / Saatlen | 5,098 |
| 330 | Sumiswald | 5,048 |
| 331 | Unterseen | 5,039 |
| 332 | Rumlang | 5,033 |
| 333 | Orbe | 5,021 |
| 334 | Uster / Ober-Uster | 4,989 |
| 335 | Chatel-Saint-Denis | 4,983 |
| 336 | Ascona | 4,973 |
| 337 | Interlaken | 4,956 |
| 338 | Bad Ragaz | 4,952 |
| 339 | Estavayer-le-Lac | 4,950 |
| 340 | Sargans | 4,934 |
| 341 | Greifensee | 4,921 |
| 342 | Wallisellen / Wallisellen-Ost | 4,920 |
| 343 | Herrliberg | 4,914 |
Religion
Christian groups in what today constitutes Switzerland already existed in the twentieth century. Diocese seats are known from before 400; monastic foundations came in the 600s. Huldreich (Ulrich) Zwingli’s Reformation in Zurich from 1519 and the Reformation movement in Geneva with Jean Calvin as leader made Switzerland a confessionally divided country. As late as 1847, the country experienced a brief religious war between Protestant and Catholic cantons; it involved the Jesuits’ access to establish institutions in the country. The result of the war was that the constitution of the federal state got a Jesuit ban, which was first repealed in 1973.
Of the Swiss population today, including foreign nationals, 26 percent belong to the group without stated confession or without belonging to any religious community (2017). Of those who belong to a religious community (5 151,000 people), nine percent belong to a non-Christian confession. Those who belong to a Christian denomination are divided by 55 percent on the Roman Catholic Church (including the ancient Catholics) and 45 percent on a Protestant denomination.
In traditionally Protestant cantons such as Geneva, Neuchâtel and Basel, church and state are separated. The Evangelical Church in Zurich and Bern, on the other hand, has the character of a state-supported national church with inner self-government. Protestant theological faculties are found at the universities of Basel, Bern, Zurich, Neuchâtel and Geneva, Catholic faculties in Friborg and Lucerne. The small minority of old Catholics have their own theological faculty at the University of Bern.
Dialectical theology, with Karl Barth and Emil Brunner as the leading names, had its center in Switzerland. The Basel Mission Company (1815) is one of the oldest in the world.
Language
Switzerland has three official languages at the national level: German, French and Italian. A fourth language, rhetorical, is a national language with the right to be used as the official language of the Canton of Graubünden.
Excluding those who do not have one of the four national languages as their mother tongue, the population is divided by 66.5 percent in German, 24.3 percent in French, 8.7 percent in Italian and 0.5 percent in rhetoran (2017).
The cantons of Neuchâtel, Vaud, Geneva and Jura are French-speaking, in Bern (Berne), Friborg (Freiburg) and Valais (Wallis) both French and German and in Ticino Italian. In the Graubünden, which is the linguistically speaking most cantonese in Switzerland, there is a clear majority who are German-speaking, but the canton has both Italian and rhetorical speaking areas. The other 17 cantons in Switzerland (including the half cantons) are purely German-speaking.
In addition to German, Italian is spoken in the Graubünden in three confined valleys south of the main water divide in the Alps (Mesolcina, Bregalia and Poschiavo). Especially for the canton is the feature of rhetoric found in several geographically distinct areas, including the Vorderrhein valley, Engadin and Val Müstair. The rhetoric speakers used several different traditional writing variants in the past, but have now developed a standardized writing norm. Although the everyday language and the language of school and administration are rhetorical in these areas, in practice the people of the rhetoran-speaking areas are bilingual with German in addition to the mother tongue.
All layers of the German-speaking population use local dialects (Schwyzerdütsch) as common speech, but the written language is high German standard language as in Germany and Austria. High German is otherwise used orally to a great extent in the media, in primary school teaching, as stage language, etc.


