Mauritius Population

The island state of Mauritius has been a stable democracy since independence, and is today among Africa’s richest countries.
Key figures and facts
- Capital: Port Louis
- Ethnic groups: Indo-Mauritians (about two-thirds of the population), Creole, Sino-Mauritians, French-Mauritians (Mauritius has not measured ethnicity on official censuses since 1972)
- Language: Creole 86.5%, bhojpuri 5.3%, French 4.1%, bilingual 1.4%, other 2.7% (including English (officially) spoken by less than 1% of the population) (2011)
- Religion: Hindus 48.5%, Roman Catholic 26.3%, Muslims 17.3%, other Christians 6.4%, other/none/unspecified 1.4% (2011)
- Population: 1 268 315 (2018)
- Control Form: Parliamentary democracy
- Area: 2 040 km2
- Currency: Mauritian Rupee
- GNP per capita: 21 103 PPP $
- National Day: March 12th
Mauritius Population
The population of Mauritius in 2013 was estimated at 1,296,000. 95% of the population lives on the main island of Mauritius. Population density (638.6 per km²) is among the highest in the world. Growth is low, 0.4%, both as a result of emigration and (since the late 1970s) declining birth rates. Every woman has an average of 1.77 children (CIA World Fact Book).
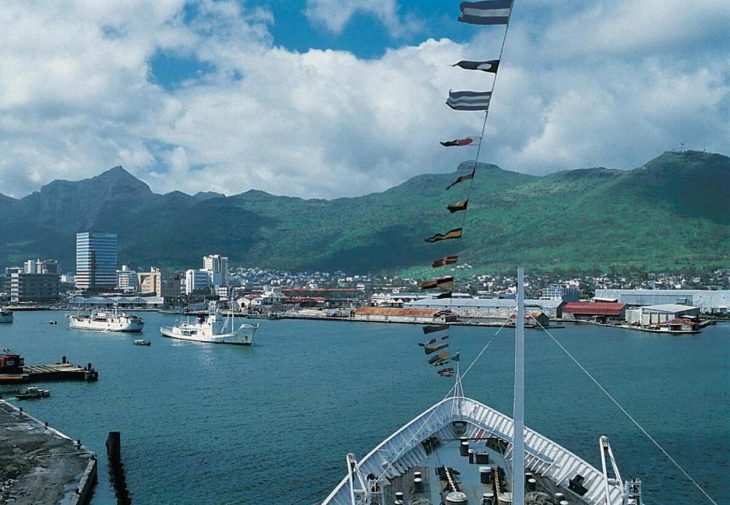
The island has no indigenous population, and all the residents are immigrated after 1600, the majority after 1835. Nearly 70% are of Indian descent, and Hinduism is the largest religious community. 27% are Creole of French-Indian or French-African origin. In addition, there are smaller groups of Europeans, essentially French, and Chinese. 42% of the population lives in cities. The largest city is the capital Port Louis with 151,000 residents.
Population of Mauritius by Year (Historical)
| Year | Population | Annual Growth Rate | Population Density | Global Rank |
| 2020 | 1,271,657 | 0.160% | 626.4867 | 157 |
| 2019 | 1,269,557 | 0.200% | 625.4522 | 157 |
| 2018 | 1,267,074 | 0.210% | 624.2291 | 157 |
| 2017 | 1,264,388 | 0.210% | 622.9059 | 155 |
| 2016 | 1,261,754 | 0.190% | 621.6084 | 155 |
| 2015 | 1,259,345 | 0.180% | 620.4217 | 155 |
| 2010 | 1,247,844 | 0.420% | 614.7562 | 154 |
| 2005 | 1,221,892 | 0.610% | 601.9719 | 153 |
| 2000 | 1,185,034 | 0.980% | 583.8153 | 153 |
| 1995 | 1,128,562 | 1.340% | 555.9965 | 150 |
| 1990 | 1,055,757 | 0.780% | 520.1320 | 150 |
| 1985 | 1,015,651 | 1.010% | 500.3754 | 150 |
| 1980 | 965,920 | 1.600% | 475.8773 | 149 |
| 1975 | 892,100 | 1.540% | 439.5128 | 147 |
| 1970 | 826,330 | 1.870% | 407.1138 | 145 |
| 1965 | 753,174 | 2.680% | 371.0763 | 145 |
| 1960 | 659,912 | 2.950% | 325.1345 | 145 |
| 1955 | 570,537 | 2.960% | 281.1074 | 146 |
| 1950 | 493,144 | 0.000% | 242.9828 | 147 |
Major Cities in Mauritius by Population
| Rank | City | Population |
| 1 | Port Louis | 155,115 |
| 2 | Beau Bassin-Rose Hill | 111,244 |
| 3 | Vacoas | 109,889 |
| 4 | Curepipe | 84,089 |
| 5 | Quatre Bornes | 80,850 |
| 6 | Triolet | 23,158 |
| 7 | Goodlands | 20,799 |
| 8 | Centre de Flacq | 17,599 |
| 9 | Bel Air Riviere Seche | 17,560 |
| 10 | Mahebourg | 16,931 |
| 11 | Saint Pierre | 16,303 |
| 12 | Bambous | 15,234 |
| 13 | Le Hochet | 15,086 |
| 14 | Rose Belle | 12,508 |
| 15 | Chemin Grenier | 12,346 |
| 16 | Riviere du Rempart | 11,564 |
| 17 | Grand Baie | 11,401 |
| 18 | Plaine Magnien | 10,667 |
| 19 | Pailles | 10,511 |
| 20 | Surinam | 10,510 |
| 21 | Lalmatie | 10,293 |
| 22 | New Grove | 9,824 |
| 23 | Riviere des Anguilles | 9,816 |
| 24 | Terre Rouge | 9,455 |
| 25 | Petit Raffray | 9,006 |
| 26 | Moka | 8,731 |
| 27 | Pamplemousses | 8,725 |
| 28 | Montagne Blanche | 8,550 |
| 29 | Grand Bois | 7,693 |
| 30 | Long Mountain | 7,664 |
| 31 | Plaine des Papayes | 7,506 |
| 32 | Pointe aux Piments | 7,445 |
| 33 | Brisee Verdiere | 7,263 |
| 34 | Nouvelle France | 7,127 |
| 35 | Grand Gaube | 7,045 |
| 36 | Poste de Flacq | 7,022 |
| 37 | Beau Vallon | 6,905 |
| 38 | Dagotiere | 6,804 |
| 39 | Bon Accueil | 6,442 |
| 40 | Quartier Militaire | 6,313 |
| 41 | Laventure | 6,060 |
| 42 | Morcellement Saint Andre | 6,039 |
| 43 | Port Mathurin | 5,889 |
| 44 | Ecroignard | 5,841 |
| 45 | Piton | 5,798 |
| 46 | Fond du Sac | 5,685 |
| 47 | Sebastopol | 5,634 |
| 48 | Roches Noire | 5,622 |
| 49 | Quatre Cocos | 5,613 |
| 50 | Petite Riviere | 5,220 |
| 51 | Camp Diable | 4,971 |
| 52 | Souillac | 4,281 |
| 53 | Tamarin | 3,653 |
Religion
Of the population, 51% are Hindus, 16.6% Muslims (mainly Pakistani immigrants), 31.3% Christians (hence 3% Protestants, the rest Catholics) and 0.6% Buddhists.
Language
English is the official language. The different ethnic groups speak their languages (Hindi, Urdu, Chinese). As a lingua franca serves a French-based Creole language.


