Libya Population
Libya became independent in 1951, as one of the first countries in Africa. In 2011, dictator Muammar al-Gaddafi was overthrown, after leading the country for 42 years. Libya today is characterized by civil war with lawlessness and armed militias.
Key figures and facts
- Capital: Tripoli
- Ethnic groups: Arabs and Berbers 97%, other 3%
- Language: Arabic, Italian, English
- Religion: Sunni Muslims 97%, other/unspecified/none 3%
- Population: 6 606 000
- Control Form: Socialist Committee Board
- Area: 1 759 540
- Currency: Dinar to 1000 dirhams
- National Day: September 1st
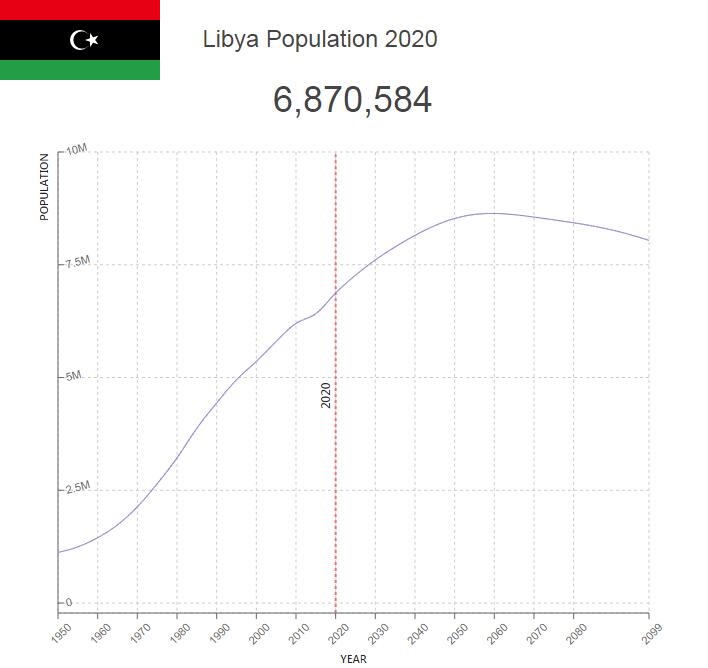
Libya’s Population
The population of Libya in 2018 was estimated at just over 6.8 million residents (World Bank). All recent statistics from Libya are uncertain due to the post- war situation in 2011 and the subsequent state dissolution, and projections are based on past tasks and projected growth. Estimated population growth has dropped to about 1.5 percent, compared to previously just over two percent.

Life expectancy before the war was 78 years. An estimated 40 percent of the population is under 25.
Population of Libya by Year (Historical)
| Year | Population | Annual Growth Rate | Population Density | Global Rank |
| 2020 | 6,871,181 | 1.380% | 3.9052 | 108 |
| 2019 | 6,777,341 | 1.480% | 3.8518 | 109 |
| 2018 | 6,678,448 | 1.490% | 3.7956 | 109 |
| 2017 | 6,580,613 | 1.360% | 3.7400 | 109 |
| 2016 | 6,492,051 | 1.150% | 3.6897 | 109 |
| 2015 | 6,418,204 | 0.700% | 3.6477 | 109 |
| 2010 | 6,197,552 | 1.340% | 3.5223 | 108 |
| 2005 | 5,798,503 | 1.590% | 3.2955 | 104 |
| 2000 | 5,357,780 | 1.600% | 3.0450 | 104 |
| 1995 | 4,948,687 | 2.210% | 2.8125 | 107 |
| 1990 | 4,436,550 | 2.750% | 2.5215 | 109 |
| 1985 | 3,873,670 | 3.770% | 2.2016 | 112 |
| 1980 | 3,219,355 | 4.010% | 1.8297 | 117 |
| 1975 | 2,645,028 | 4.390% | 1.5033 | 122 |
| 1970 | 2,133,415 | 4.240% | 1.2126 | 126 |
| 1965 | 1,733,195 | 3.660% | 0.9851 | 128 |
| 1960 | 1,448,306 | 3.070% | 0.8232 | 132 |
| 1955 | 1,245,247 | 2.060% | 0.7078 | 132 |
| 1950 | 1,124,404 | 0.000% | 0.6391 | 131 |
Major Cities in Libya by Population
| Rank | City | Population |
| 1 | Tripoli | 1,150,878 |
| 2 | Benghazi | 650,518 |
| 3 | Misratah | 386,009 |
| 4 | Tarhuna | 210,586 |
| 5 | Al Khums | 201,832 |
| 6 | Az Zawiyah | 199,889 |
| 7 | Zawiya | 186,012 |
| 8 | Ajdabiya | 134,247 |
| 9 | Al Ajaylat | 130,435 |
| 10 | Sabha | 129,889 |
| 11 | Sirte | 128,012 |
| 12 | Al Jadid | 126,275 |
| 13 | Tobruk | 120,941 |
| 14 | Zliten | 109,861 |
| 15 | Sabratah | 101,927 |
| 16 | Tagiura | 99,889 |
| 17 | Al Marj | 85,204 |
| 18 | Gharyan | 85,108 |
| 19 | Darnah | 78,671 |
| 20 | Al Bayda’ | 74,483 |
| 21 | Yafran | 67,527 |
| 22 | Bani Walid | 46,239 |
| 23 | At Taj | 45,939 |
| 24 | Zuwarah | 44,889 |
| 25 | Murzuq | 43,621 |
| 26 | Ubari | 42,864 |
| 27 | Brak | 39,333 |
| 28 | Zintan | 32,889 |
| 29 | Al Abyar | 32,452 |
| 30 | Waddan | 27,479 |
| 31 | Nalut | 26,145 |
| 32 | Mizdah | 25,996 |
| 33 | Surman | 25,124 |
| 34 | Al Qubbah | 24,520 |
| 35 | Ghat | 24,236 |
| 36 | Masallatah | 23,591 |
| 37 | Tukrah | 23,053 |
| 38 | Az Zuwaytinah | 20,904 |
| 39 | Hun | 18,767 |
| 40 | Zaltan | 17,589 |
| 41 | Al Jawf | 17,209 |
| 42 | Qaryat Suluq | 15,432 |
| 43 | Al Burayqah | 13,669 |
| 44 | Al Bardiyah | 9,038 |
| 45 | Ghadamis | 6,889 |
| 46 | Awjilah | 6,499 |
| 47 | Giado | 5,902 |
| 48 | Idri | 4,500 |
| 49 | Al ‘Aziziyah | 3,889 |
Settlement Pattern
Libya is sparsely populated. More than 80 percent of the population lives in cities; about 90 percent along the coast, where most of the economic activity takes place. Here are also the two largest cities: Tripoli, Misrata and Benghazi.
The settlement is concentrated to the coastal zone, and the migration to the largest cities has been significant in recent decades. The economic activity in Libya is mainly on the coast. The largest cities are the capital Tripoli and Benghazi.
Population Composition
Libya’s population is ethnically homogeneous and consists essentially of Arabs, but also includes groups of Berbers (Amazigh) and Tuareg, as well as other smaller groups; among them nomadic people teda in the southeast. Around 97 percent of the population are Muslims (Sunni).
There are no longer reliable figures on the number of foreign nationals in the country. Previously, there were a significant number of guest workers, especially from countries in Africa and the Middle East, in Libya. As a result of the war, many have lost their jobs, while there has been a large influx to Libya, which has become a major transit country for human smuggling into Europe. The UN estimates that around 12 percent of the population are immigrants (2017).
Former groups of Greeks and Maltese have been reduced, among other things, as a result of the war. The former Jewish minority emigrated to Israel after this state was created in 1948. The substantial Italian population of the early 1900s was gradually reduced around the Second World War, and most of the remaining around 35,000 Italians had to leave the country in 1970.


