Liberia Population
Liberia is Africa’s oldest republic and was founded by freed American slaves in 1821.
Key figures and facts
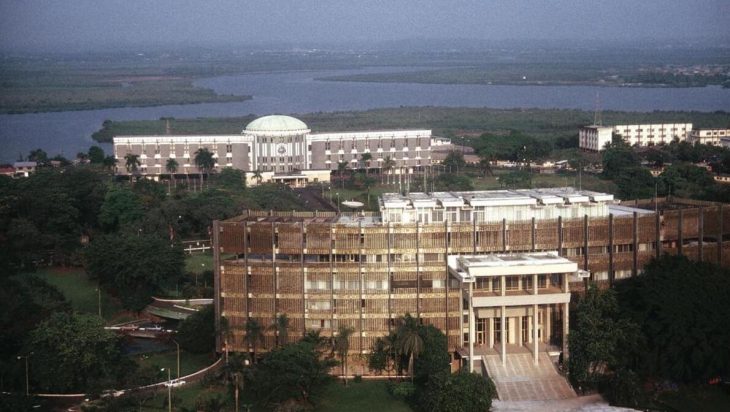
- Capital: Monrovia
- Ethnic groups: Kpelle 20.3%, Bassa 13.4%, Grebo 10%, Gio 8%, other African people 43.7%, other 3.2% (2008)
- Language: English (official) 20%, around 20 African tribal languages
- Religion: Christians 85.6%, Muslims 12.2%, others 0.8%, none 1.5% (2008)
- Population: 4,853,516 (2017)
- Control Form: Republic
- Area: 111 370 km2
- Currency: Dollar at 100 cents
- GNP per capita: 813 PPP $
- National Day: July 26th
Liberia’s Population
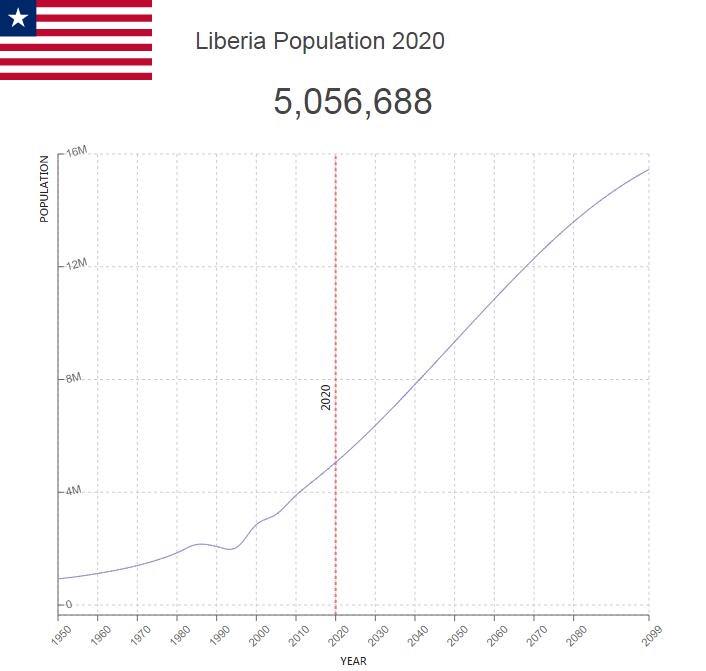
Liberia’s population is estimated at 5.07 million (2020). Annual average population growth is estimated at 2.7 percent. High birth rates, combined with a high mortality rate, have resulted in a very young population, and about 43 percent are under the age of 15.
Many fled the country because of the civil war that took place from 1989 to 2003, and very many became refugees within the country’s borders. Although the civil war has ended, most people live in great distress, with food and water shortages and with poor sanitary conditions. 1.3 percent of the adult population has HIV (2018), while 3,700 children under 15 are infected.
Population of Liberia by Year (Historical)
| Year | Population | Annual Growth Rate | Population Density | Global Rank |
| 2020 | 5,057,570 | 2.440% | 52.5091 | 123 |
| 2019 | 4,937,263 | 2.460% | 51.2601 | 123 |
| 2018 | 4,818,862 | 2.480% | 50.0309 | 123 |
| 2017 | 4,702,115 | 2.520% | 48.8188 | 123 |
| 2016 | 4,586,676 | 2.560% | 47.6203 | 124 |
| 2015 | 4,472,119 | 2.820% | 46.4310 | 125 |
| 2010 | 3,891,245 | 3.870% | 40.4003 | 128 |
| 2005 | 3,218,005 | 2.470% | 33.4107 | 133 |
| 2000 | 2,848,345 | 6.860% | 29.5728 | 135 |
| 1995 | 2,044,550 | -0.300% | 21.2278 | 141 |
| 1990 | 2,075,801 | -0.660% | 21.5522 | 139 |
| 1985 | 2,145,643 | 2.980% | 22.2773 | 134 |
| 1980 | 1,852,890 | 2.970% | 19.2380 | 135 |
| 1975 | 1,600,341 | 2.700% | 16.6160 | 136 |
| 1970 | 1,400,619 | 2.380% | 14.5425 | 136 |
| 1965 | 1,244,991 | 2.160% | 12.9267 | 136 |
| 1960 | 1,118,546 | 2.040% | 11.6140 | 136 |
| 1955 | 1,011,252 | 1.690% | 10.5000 | 135 |
| 1950 | 929,919 | 0.000% | 9.6556 | 136 |
Major Cities in Liberia by Population
| Rank | City | Population |
| 1 | Monrovia | 939,413 |
| 2 | Gbarnga | 45,724 |
| 3 | Kakata | 33,834 |
| 4 | Bensonville | 33,077 |
| 5 | Harper | 32,550 |
| 6 | Voinjama | 26,483 |
| 7 | Buchanan | 25,620 |
| 8 | Zwedru | 25,567 |
| 9 | New Yekepa | 24,584 |
| 10 | Greenville | 16,323 |
| 11 | Ganta | 13,691 |
| 12 | Robertsport | 11,858 |
| 13 | Sanniquellie | 11,304 |
| 14 | Fish Town | 3,217 |
| 15 | Tubmanburg | 3,044 |
| 16 | Bopolu | 2,797 |
| 17 | Barclayville | 2,622 |
| 18 | Cestos City | 2,467 |
People Groups
The population comprises a number of different ethnic groups. The largest and most well-known are the man-speaking chapel, malinke (manding), mano, loma and vai as well as the cru-speaking bass, de, grebo and kru. In the northern part of the country live among other kissi and gola, who speak the language of the Atlantic group.
The politically dominant group of people in Liberia are the so-called “americo-liberians”. Most descendants of people who immigrated to Liberia from America in the years 1820-1865, in connection with the cessation of the transatlantic slave trade. Their numbers are now just under 50,000, but they still have significant political influence, although the 1980 coup weakened their position and official gender equality policies have given greater influence to members of the other ethnic groups.
People Density
The population is unevenly distributed across the country, with a marked concentration around the capital Monrovia. 52 percent live in cities and towns (2020).
Language
English is the official language. The local languages belong to three main groups: man, Kru and West Atlantic languages in the Niger-Congo family.
Religion
About half of the population belongs to various traditional local religions, while Islam and Christianity are the two main religions with a support of 14 percent and 37 percent respectively. About 3 percent are Catholics, 20 percent are Protestant, and 14 percent are native churches.


