Chad Population

Chad became an independent republic in 1960, and has since been characterized by instability, civil war and armed conflict. In 2003, Chad started to export oil, but the revenues have not benefited the general population.
Key figures and facts
- Capital: N’Djamena
- Ethnic groups: Sara (Ngambaye/Sara/Madjingaye/Mbaye) 30.5%, Kanembu/Bornu/Buduma 9.8%, Arabs 9.7%, Wadai/Maba/Masalit/Mimi 7%, Gorane 5.8%, Masa/Musseye/Musgum 4.9%, Bulala/Medogo/Kuka 3.7%, Marba/Lele/Mesme 3.5%, Mundang 2.7%, Bidiyo/Migaama/Kenga/Dangleat 2.5%, Dadjo/Kibet/Muro 2.4%, Tupuri/Kera 2%, Gabri/Kabalaye/Nanchere/Somrai 2%, Fulani/Fulbe/Bodore 1.8%, Karo/Zime/Peve 1.3%, Baguirmi/Barma 1.2%, Zaghawa/Bideyat/Kobe 1.1%, Tama/Assongori/Mararit 1.1%, Mesmedje/Massalat/Kadjakse 0.8%, other Chadian people groups 3.4%, Chadians with foreign background 0.9%, foreigners 0.3%, unspecified 1.7% (2015)
- Language: French and Arabic (official), sara (south of the country). Over 120 different languages and dialects.
- Religion: Muslims 52.1%, Protestants 23.9%, Roman Catholic 20%, animists 0.3%, nobody/others 3.7% (2015)
- Population: 15,353,184 (2018)
- Control Form: Republic
- Area: 1 284 000 km2
- Currency: CFA franc
- GNP per capita: 1 991 PPP $
- National Day: August 11th
Chad’s Population
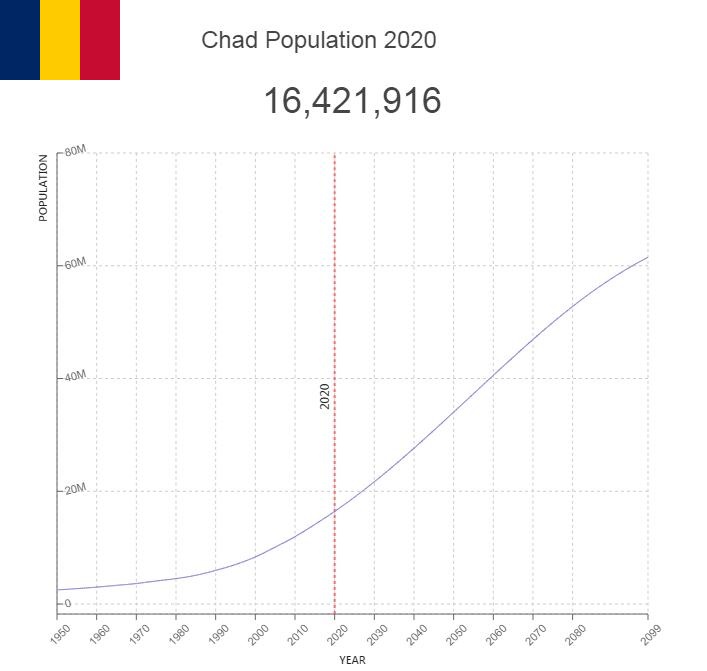
The population of Chad in 2019 was estimated at around 16,000,000, and annual population growth to about three percent. Life expectancy is 55 years for women and 53 years for men (2016). About half of the population is under 15 years of age.

Population of Chad by Year (Historical)
| Year | Population | Annual Growth Rate | Population Density | Global Rank |
| 2020 | 16,425,753 | 3.000% | 13.0447 | 72 |
| 2019 | 15,946,765 | 3.030% | 12.6643 | 72 |
| 2018 | 15,477,618 | 3.070% | 12.2917 | 72 |
| 2017 | 15,016,642 | 3.130% | 11.9256 | 72 |
| 2016 | 14,561,549 | 3.190% | 11.5642 | 72 |
| 2015 | 14,110,864 | 3.380% | 11.2063 | 72 |
| 2010 | 11,952,025 | 3.430% | 9.4918 | 74 |
| 2005 | 10,096,522 | 3.860% | 8.0183 | 80 |
| 2000 | 8,355,543 | 3.570% | 6.6357 | 87 |
| 1995 | 7,010,034 | 3.290% | 5.5671 | 91 |
| 1990 | 5,963,141 | 3.200% | 4.7358 | 93 |
| 1985 | 5,095,290 | 2.450% | 4.0465 | 98 |
| 1980 | 4,514,319 | 2.000% | 3.5852 | 100 |
| 1975 | 4,088,453 | 2.330% | 3.2470 | 99 |
| 1970 | 3,643,493 | 1.940% | 2.8936 | 101 |
| 1965 | 3,309,475 | 1.970% | 2.6283 | 100 |
| 1960 | 3,001,498 | 1.880% | 2.3837 | 100 |
| 1955 | 2,735,087 | 1.800% | 2.1722 | 98 |
| 1950 | 2,502,208 | 0.000% | 1.9872 | 97 |
Major Cities in Chad by Population
| Rank | City | Population |
| 1 | N’Djamena | 720,970 |
| 2 | Moundou | 135,056 |
| 3 | Sarh | 102,417 |
| 4 | Abeche | 74,077 |
| 5 | Kelo | 42,422 |
| 6 | Koumra | 36,152 |
| 7 | Pala | 35,355 |
| 8 | Am Timan | 28,774 |
| 9 | Bongor | 27,659 |
| 10 | Mongo | 27,652 |
| 11 | Doba | 24,225 |
| 12 | Ati | 23,963 |
| 13 | Fada | 23,675 |
| 14 | Lai | 19,271 |
| 15 | Oum Hadjer | 19,160 |
| 16 | Bitkine | 18,384 |
| 17 | Mao | 17,920 |
| 18 | Massaguet | 17,795 |
| 19 | Dourbali | 17,571 |
| 20 | Mboursou Lere | 17,021 |
| 21 | Kyabe | 16,066 |
| 22 | Benoy | 15,606 |
| 23 | Massakory | 15,295 |
| 24 | Moussoro | 15,079 |
| 25 | Bokoro | 14,612 |
| 26 | Bere | 14,555 |
| 27 | Bousso | 13,444 |
| 28 | Faya-Largeau | 13,289 |
| 29 | Bebedja | 12,560 |
| 30 | Ngama | 12,327 |
| 31 | Adre | 11,817 |
| 32 | Bol | 11,589 |
| 33 | Guelendeng | 11,268 |
| 34 | Moissala | 11,153 |
| 35 | Biltine | 10,889 |
| 36 | Goundi | 9,941 |
| 37 | Gounou Gaya | 9,410 |
| 38 | Beinamar | 7,334 |
| 39 | Melfi | 5,673 |
| 40 | Beboto | 5,321 |
| 41 | Massenya | 3,569 |
| 42 | Goz Beida | 889 |
Population composition and ethnic groups
The population is very composed even by African conditions, and includes a variety of ethnic groups. The largest group is Arabs, which dominate the country’s northern and central areas. Sara and bagirma (the founders of the ancient kingdom of Baguirmi) are the largest groups in the south.
The agricultural population in the southern areas of the country belongs to a large number of smaller ethnic groups with differences in language and culture. In the northern areas, nomads, especially tubu and goran, live. Over the past ten years Chad has received hundreds of thousands of refugees from Darfur in Sudan, but also tens of thousands from the Central African Republic.
Settlement Pattern
The population density is 10.2 residents per km², but the population is very unevenly distributed over the country. The closest resident is the southern, precipitous part of the country. Here are the largest cities, the capital N’Djamena, which has 1.5–2 million residents, Moundou, Bongor and Sarh. Around a third of the population lives in cities.
Religion
More than 45 percent of the population are Muslims. The Christians make up about 35 percent, of which about 14 percent are Protestants and 21 percent are Catholics. The others belong to local, traditional religions.
Language
Official languages are French and Arabic. In the country, more than 100 languages and dialects are spoken by different language families. Among the Afro-Asian family are local dialects of Arabic, which are widely used in the north and around the capital, besides the language branch Chad in the middle of the country. In the south, languages in the Niger-Congo family are spoken, including sara, mundang and tuburi as well as Nilo-saharas.


