Ireland Population

The Republic of Ireland has a long history of political unrest, poverty and conflict with the United Kingdom. Having been severely affected by the global financial crisis in 2008, Ireland has developed into a rich country with good living conditions and political stability.
Key figures and facts
- Capital: Dublin
- Ethnic groups: Irish 82.2%, Popes 0.7% second of European origin 9.5%, Asians 2.1%, African origin 1.4%, other 1.1%, unspecified 2.6%
- Language: English (official), Irish/Gaelic (official)
- Religion: Roman Catholic 78.3%, Irish Church 2.7%, other Christians 1.6%, Orthodox 1.3%, Muslims 1.3%, other/unspecified/none 14.8%
- Population: 4,803,748 (2018)
- Control Form: Republic
- Area: 70 280 km2
- Currency: euro
- GNP per capita: 71 472 PPP $
- National Day: March 17th
Population of Ireland
In 2016, the population of Ireland was estimated at 4,757,976 (World Bank 2016), while it was 6.5 million in 1841. This severe decline was due to both famine and emigration.
In the late 1840s, the potato crops were hit by repeated catastrophic destruction, and nearly one million people died of starvation. At the same time, over 1.5 million emigrated, mostly to the United States. Later, Britain became the most important target of emigration. Between 1841 and 1920, a total of 4.5 million Irish emigrated, and the emigration is still relatively large.
The population declined until the 1960s, but has subsequently grown, but with some periods of decline due to high emigration. Natural growth (born ÷ dead) is very high in the European context. In 2016, the birth rate was 13.7 ‰ and mortality 6.5 ‰ (World Bank). Due to continued emigration, the annual real growth in population (2016) is 0.86%.
Life expectancy is 82.6 years for women and 78 years for men.
The population is of Celtic origin with strong elements of Scandinavians and Anglo-Saxons.
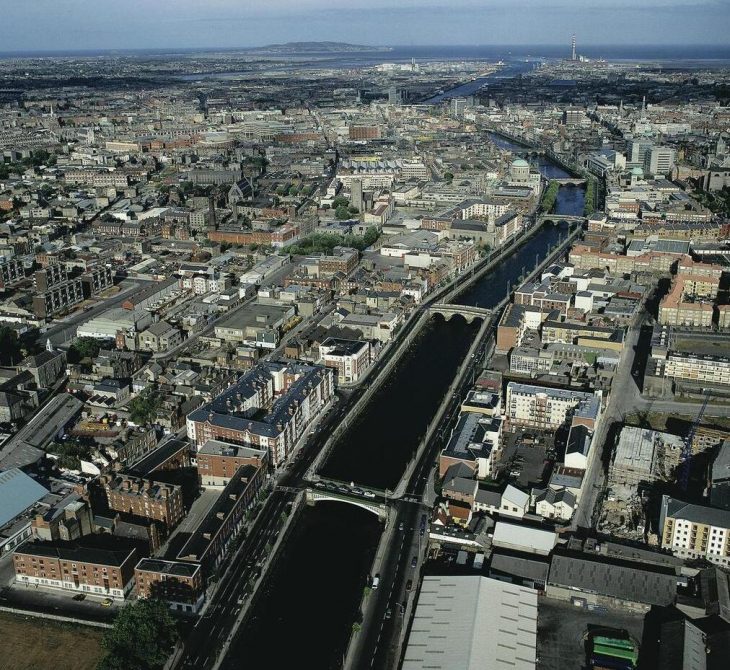
Within the country there has been a migration of people from the inner regions and out to the coast, where most cities are located. The largest cities are the capital Dublin and Cork.
Population of Ireland by Year (Historical)
| Year | Population | Annual Growth Rate | Population Density | Global Rank |
| 2020 | 4,937,675 | 1.130% | 71.6764 | 124 |
| 2019 | 4,882,384 | 1.320% | 70.8738 | 124 |
| 2018 | 4,818,579 | 1.380% | 69.9476 | 124 |
| 2017 | 4,753,168 | 1.230% | 68.9981 | 121 |
| 2016 | 4,695,668 | 0.930% | 68.1634 | 121 |
| 2015 | 4,652,314 | 0.430% | 67.5341 | 121 |
| 2010 | 4,554,210 | 1.920% | 66.1100 | 120 |
| 2005 | 4,141,112 | 1.820% | 60.1136 | 123 |
| 2000 | 3,782,992 | 1.040% | 54.9151 | 123 |
| 1995 | 3,592,075 | 0.460% | 52.1438 | 122 |
| 1990 | 3,510,774 | 0.000% | 50.9636 | 122 |
| 1985 | 3,510,868 | 0.730% | 50.9650 | 118 |
| 1980 | 3,384,645 | 1.530% | 49.1328 | 114 |
| 1975 | 3,137,065 | 1.530% | 45.5389 | 113 |
| 1970 | 2,908,310 | 0.590% | 42.2183 | 110 |
| 1965 | 2,823,539 | 0.230% | 40.9878 | 107 |
| 1960 | 2,791,286 | -0.580% | 40.5196 | 104 |
| 1955 | 2,873,304 | -0.270% | 41.7102 | 95 |
| 1950 | 2,912,569 | 0.000% | 42.2802 | 91 |
Major Cities in Ireland by Population
| Rank | City | Population |
| 1 | Dublin | 1,023,916 |
| 2 | Cork | 190,273 |
| 3 | Dun Laoghaire | 185,289 |
| 4 | Luimneach | 89,943 |
| 5 | Gaillimh | 70,575 |
| 6 | Tallaght | 64,171 |
| 7 | Waterford | 47,793 |
| 8 | Swords | 36,813 |
| 9 | Drogheda | 33,330 |
| 10 | Dundalk | 33,317 |
| 11 | Navan | 24,434 |
| 12 | Ennis | 24,316 |
| 13 | Balbriggan | 23,253 |
| 14 | Tralee | 22,830 |
| 15 | Sandyford | 22,177 |
| 16 | Kilkenny | 21,478 |
| 17 | Naas | 20,602 |
| 18 | Sligo | 20,117 |
| 19 | Carlow | 19,944 |
| 20 | Loch Garman | 19,802 |
| 21 | Finglas | 19,657 |
| 22 | Celbridge | 19,426 |
| 23 | Droichead Nua | 18,749 |
| 24 | Cluain Meala | 17,283 |
| 25 | An Muileann gCearr | 17,151 |
| 26 | Letterkenny | 16,790 |
| 27 | Blanchardstown | 16,400 |
| 28 | Athlone | 15,840 |
| 29 | Malahide | 15,735 |
| 30 | Leixlip | 15,341 |
| 31 | Donaghmede | 15,188 |
| 32 | Lucan | 15,158 |
| 33 | Kilquade | 14,775 |
| 34 | Carrigaline | 14,664 |
| 35 | Knocklyon | 14,517 |
| 36 | Clondalkin | 14,397 |
| 37 | Wicklow | 13,937 |
| 38 | Portlaoise | 13,511 |
| 39 | Greystones | 13,381 |
| 40 | Castlebar | 12,763 |
| 41 | Foxrock | 12,759 |
| 42 | Athy | 12,744 |
| 43 | Maynooth | 12,399 |
| 44 | Dundrum | 12,041 |
| 45 | Arklow | 11,650 |
| 46 | Tullamore | 11,464 |
| 47 | Ashbourne | 11,244 |
| 48 | Crumlin | 11,183 |
| 49 | Rathmines | 10,933 |
| 50 | Marino | 10,912 |
| 51 | Laytown | 10,778 |
| 52 | Jobstown | 10,714 |
| 53 | Donnybrook | 10,534 |
| 54 | Cobh | 10,390 |
| 55 | Shankill | 9,991 |
| 56 | Ballina | 9,976 |
| 57 | Cabinteely | 9,927 |
| 58 | Derry | 9,889 |
| 59 | Oldbawn | 9,673 |
| 60 | Enniscorthy | 9,598 |
| 61 | Shannon | 9,562 |
| 62 | Skerries | 9,560 |
| 63 | Ballyboden | 9,500 |
| 64 | Mallow | 9,384 |
| 65 | Portmarnock | 9,174 |
| 66 | An Ros | 9,120 |
| 67 | Tra Mhor | 9,053 |
| 68 | Balally | 8,940 |
| 69 | Ratoath | 8,932 |
| 70 | Sandymount | 8,856 |
| 71 | Midleton | 8,780 |
| 72 | Blackrock | 8,710 |
| 73 | Beaumont | 8,498 |
| 74 | Ballyfermot | 8,447 |
| 75 | Ballinteer | 8,436 |
| 76 | Rathgar | 8,283 |
| 77 | Castleknock | 8,190 |
| 78 | Ringsend | 8,091 |
| 79 | Kildare | 8,031 |
| 80 | Baldoyle | 7,932 |
| 81 | Little Bray | 7,904 |
| 82 | Cherry Orchard | 7,813 |
| 83 | Mount Merrion | 7,735 |
| 84 | Portarlington | 7,677 |
| 85 | Longford | 7,676 |
| 86 | Terenure | 7,563 |
| 87 | Donnycarney | 7,549 |
| 88 | Thurles | 7,477 |
| 89 | Dungarvan | 7,440 |
| 90 | Cill Airne | 7,189 |
| 91 | Palmerstown | 7,086 |
| 92 | Raheny | 7,086 |
| 93 | Booterstown | 7,031 |
| 94 | Templeogue | 6,912 |
| 95 | Lusk | 6,911 |
| 96 | Dunboyne | 6,848 |
| 97 | Sallynoggin | 6,805 |
| 98 | Greenhills | 6,765 |
| 99 | Youghal | 6,757 |
| 100 | Firhouse | 6,748 |
| 101 | Newtown Trim | 6,670 |
| 102 | Donabate | 6,667 |
| 103 | Clane | 6,591 |
| 104 | New Ross | 6,584 |
| 105 | Nenagh Bridge | 6,561 |
| 106 | Dalkey | 6,511 |
| 107 | Bray | 6,366 |
| 108 | Ballinasloe | 6,277 |
| 109 | Cavan | 6,277 |
| 110 | Cherryville | 6,269 |
| 111 | Newcastle West | 6,216 |
| 112 | Ballymun | 6,151 |
| 113 | Westport | 6,089 |
| 114 | Tuam | 6,019 |
| 115 | Gorey | 5,929 |
| 116 | Monaghan | 5,826 |
| 117 | Hartstown | 5,771 |
| 118 | Kinsealy-Drinan | 5,703 |
| 119 | Carrick-on-Suir | 5,599 |
| 120 | Roscommon | 5,582 |
| 121 | Darndale | 5,556 |
| 122 | Monkstown | 5,444 |
| 123 | Buncrana | 5,435 |
| 124 | Kilcock | 5,422 |
| 125 | Nenagh | 5,389 |
| 126 | Bandon | 5,381 |
| 127 | Roscrea | 5,292 |
| 128 | Confey | 5,278 |
| 129 | Eadestown | 5,235 |
| 130 | Artane | 5,217 |
| 131 | Chapelizod | 5,185 |
| 132 | Sallins | 5,172 |
| 133 | Killester | 4,988 |
| 134 | Dollymount | 4,959 |
| 135 | Loughrea | 4,951 |
| 136 | Blessington | 4,899 |
Language
Official languages are Irish and English. English dominates as both oral and written language. The vast majority of Irish speakers are bilingual with Irish as a second language. The Irish-speaking districts (Gaeltacht) are located on the islands and along the coast to the west.


