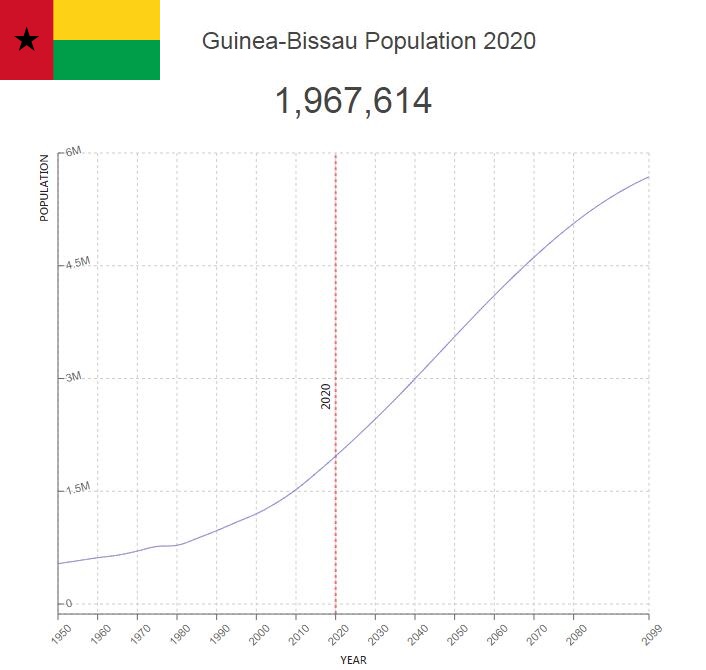
Guinea-Bissau Population
Guinea-Bissau is one of the world’s poorest countries and has been politically unstable since its release in 1974. Since the 2000s, political instability has made the country a favorite transit country for drug smuggling to and from Europe.
Key figures and facts
- Capital: Bissau
- Ethnic groups: Fulani 28.5%, balanta 22.5%, mandinga 14.7%, papel 9.1%, manjaco 8.3%, befada 3.5%, mancanha 3.1%, bijago 2.1%, felupe 1.7%, mansoanca 1.4%, balanta mane 1%, other 1.8%, none 2.2% (2008)
- Language: Portuguese (official), African languages
- Religion: Muslims 45.1%, Christians 22.1%, animism 14.9%, none 2%, unspecified 15.9% (2008)
- Population: 1 907 268 (2018)
- Control Form: Republic
- Area: 36 130 Km2
- Currency: CFA franc
- GNP per capita: 1 609 PPP $
- National Day: September 24th
Guinea-Bissau Population
In 2013, the population of Guinea-Bissau was estimated at 1,704,000 and annual population growth at 2.4%. Infant mortality is high, 77.9 per 1,000 live births, but is steadily declining. Life expectancy at birth is among the world’s lowest, 55.6 years for women and 52.5 years for men. The country has a young population. About 41.5% of the population is under 15 years.

Guinea-Bissau’s population is divided into seven ethnic groups. The largest group is balanced (about 30%), mainly living in the coastal area; here also live mandjak (14%) and pepel (7%), besides the population of the Bijagós Islands (bidjogo). These groups have a traditional form of organization without state formation or other major political associations, and they were leaders in the war against Portugal. Inland, the male-speaking Malinke people live (mandingo, 13%) and in southern fulani (20%).
The country is relatively sparsely populated (60.6 per km²), with the highest population density in the northwestern part of the coastal area and in the eastern part of the inland surrounding Bafatá. Most people live and work in rural areas, 47.7% live in cities (2013). Only major city is the capital Bissau with approximately 423,000 residents (UNdata 2011).
Population of Guinea-Bissau by Year (Historical)
| Year | Population | Annual Growth Rate | Population Density | Global Rank |
| 2020 | 1,967,890 | 2.450% | 69.9858 | 150 |
| 2019 | 1,920,811 | 2.490% | 68.3116 | 150 |
| 2018 | 1,874,192 | 2.530% | 66.6537 | 151 |
| 2017 | 1,828,034 | 2.560% | 65.0123 | 151 |
| 2016 | 1,782,327 | 2.600% | 63.3868 | 151 |
| 2015 | 1,737,091 | 2.670% | 61.7782 | 151 |
| 2010 | 1,522,488 | 2.510% | 54.1465 | 151 |
| 2005 | 1,344,819 | 2.280% | 47.8282 | 151 |
| 2000 | 1,201,190 | 1.980% | 42.7205 | 152 |
| 1995 | 1,088,743 | 2.230% | 38.7217 | 152 |
| 1990 | 975,150 | 2.260% | 34.6821 | 151 |
| 1985 | 872,052 | 2.210% | 31.0158 | 151 |
| 1980 | 781,566 | 0.410% | 27.7979 | 151 |
| 1975 | 765,878 | 1.680% | 27.2400 | 149 |
| 1970 | 704,828 | 1.640% | 25.0690 | 149 |
| 1965 | 649,679 | 1.070% | 23.1077 | 148 |
| 1960 | 616,025 | 1.350% | 21.9109 | 147 |
| 1955 | 576,025 | 1.480% | 20.4885 | 145 |
| 1950 | 535,317 | 0.000% | 19.0408 | 144 |
Major Cities in Guinea-Bissau by Population
| Rank | City | Population |
| 1 | Bissau | 387,917 |
| 2 | Bafata | 22,410 |
| 3 | Gabu | 14,319 |
| 4 | Bissora | 12,577 |
| 5 | Bolama | 10,658 |
| 6 | Cacheu | 10,379 |
| 7 | Catio | 9,787 |
| 8 | Bubaque | 9,133 |
| 9 | Mansoa | 7,710 |
| 10 | Buba | 7,668 |
| 11 | Quebo | 6,961 |
| 12 | Canchungo | 6,742 |
| 13 | Farim | 6,681 |
| 14 | Quinhamel | 3,017 |
Language
The official language is Portuguese. The African languages fall into two main groups. The West Atlantic languages include balante, fulani and mandyako. Among the human languages include malinka and bambara. An important trade and aid language is crioulo, a mixture of Portuguese and African languages.
Religion
Guinea-Bissau, 48% belong to various local religions, 44% are Muslims, while approximately 8% are Christians.


