Guatemala Population
Guatemala has Central America’s strongest economy, but only a small portion of the population has access to wealth. Since the end of the civil war in 1996, violence, corruption and gang crime have been a major societal problem.
Key figures and facts
- Capital: Guatemala city
- Ethnic groups: Mestis (mixture of Spanish and indigenous people) and Europeans 60.1%, Maya 39.3% (k’iche 11.3%, q’eqchi 7.6%, kaqchikel 7.4%, mam 5.5%, other 7.5%) non-maya, non-mastis 0.15% (xinca (indigenous, non-maya), garifuna (mix of West and Central African, Caribbean indigenous and Arabian)), other 0.5% (2001)
- Language: Spanish (official) 68.9%, Mayan language 30.9% (k’iche 8.7%, q’eqchi 7%, mam 4.6%, kaqchikel 4.3%, other 6.3%), other 0.3% (including xinca and garifuna) (2001), (There are 23 officially recognized origins, including 21 Mayan languages, xinca and garifuna)
- Religion: Roman Catholic, Protestant, Mayan religions
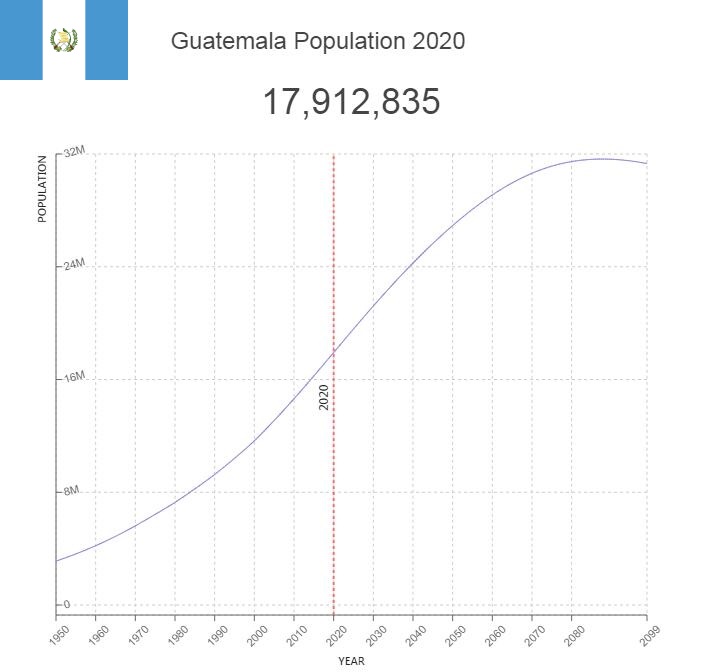
- Population: 17 245 346 (2018)
- Control Form: Republic
- Area: 108 890 km2
- Currency: Quetzal
- GNP per capita: 7 945 PPP $
- National Day: September 15th
Guatemala population
Guatemala’s population was estimated at 17.3 million by 2020 and annual population growth to 1.68 percent. The country has the highest birth rate in Latin America (23.3 per thousand) and the youngest population; Around 50 percent are 19 years or younger. Life expectancy is 76.8 years for women and 73.6 years for men. Infant mortality is 23.5 per 100,000, highest in Latin America.

The economic and social differences are large and poverty is widespread, especially in the rural areas where most indigenous people live. Between 2006 and 2014, the proportion of poor people increased from 51.2 to 59.3 percent and the proportion of extremely poor persons in 2014 was 15.7 percent.
Guatemala is also Latin America’s least urbanized country and one of the most ethnically composed. A little over 40 percent of the population are indigenous people, the vast majority of whom are Mayans.
Population of Guatemala by Year (Historical)
| Year | Population | Annual Growth Rate | Population Density | Global Rank |
| 2020 | 17,915,457 | 1.900% | 167.1852 | 66 |
| 2019 | 17,581,361 | 1.930% | 164.0675 | 66 |
| 2018 | 17,247,738 | 1.970% | 160.9542 | 66 |
| 2017 | 16,914,859 | 2.000% | 157.8478 | 67 |
| 2016 | 16,582,965 | 2.030% | 154.7506 | 67 |
| 2015 | 16,252,318 | 2.130% | 151.6651 | 67 |
| 2010 | 14,630,306 | 2.240% | 136.5287 | 67 |
| 2005 | 13,095,917 | 2.370% | 122.2100 | 67 |
| 2000 | 11,650,632 | 2.280% | 108.7229 | 66 |
| 1995 | 10,408,378 | 2.360% | 97.1304 | 68 |
| 1990 | 9,263,702 | 2.370% | 86.4484 | 74 |
| 1985 | 8,239,949 | 2.500% | 76.8949 | 75 |
| 1980 | 7,283,348 | 2.510% | 67.9681 | 76 |
| 1975 | 6,433,617 | 2.730% | 60.0385 | 76 |
| 1970 | 5,621,681 | 2.910% | 52.4617 | 78 |
| 1965 | 4,869,605 | 2.950% | 45.4434 | 77 |
| 1960 | 4,210,636 | 3.040% | 39.2940 | 79 |
| 1955 | 3,625,189 | 3.080% | 33.8307 | 83 |
| 1950 | 3,114,846 | 0.000% | 29.0683 | 86 |
Major Cities in Guatemala by Population
| Rank | City | Population |
| 1 | Guatemala City | 994,827 |
| 2 | Mixco | 472,969 |
| 3 | Villa Nueva | 406,719 |
| 4 | Petapa | 141,344 |
| 5 | San Juan Sacatepequez | 136,775 |
| 6 | Quetzaltenango | 132,119 |
| 7 | Villa Canales | 122,083 |
| 8 | Escuintla | 103,054 |
| 9 | Chinautla | 97,061 |
| 10 | Chimaltenango | 82,259 |
| 11 | Chichicastenango | 79,648 |
| 12 | Huehuetenango | 79,315 |
| 13 | Amatitlan | 71,725 |
| 14 | Totonicapan | 69,623 |
| 15 | Santa Catarina Pinula | 67,883 |
| 16 | Santa Lucia Cotzumalguapa | 61,986 |
| 17 | Puerto Barrios | 56,494 |
| 18 | San Francisco El Alto | 54,382 |
| 19 | Coban | 53,264 |
| 20 | San Jose Pinula | 47,136 |
| 21 | San Pedro Ayampuc | 46,692 |
| 22 | Jalapa | 45,723 |
| 23 | Coatepeque | 45,543 |
| 24 | Solola | 45,262 |
| 25 | Mazatenango | 44,021 |
| 26 | Chiquimula | 41,410 |
| 27 | San Pedro Sacatepequez | 39,910 |
| 28 | Salama | 39,889 |
| 29 | Antigua Guatemala | 39,257 |
| 30 | Retalhuleu | 36,545 |
| 31 | Zacapa | 35,977 |
| 32 | Jutiapa | 34,221 |
| 33 | Jacaltenango | 33,973 |
| 34 | Santiago Atitlan | 33,198 |
| 35 | Momostenango | 31,628 |
| 36 | Palin | 31,218 |
| 37 | San Benito | 30,653 |
| 38 | Barberena | 30,428 |
| 39 | Ciudad Vieja | 30,092 |
| 40 | Ostuncalco | 28,783 |
| 41 | Fraijanes | 28,381 |
| 42 | Nahuala | 27,579 |
| 43 | Cantel | 25,952 |
| 44 | Panzos | 25,458 |
| 45 | San Marcos | 24,977 |
| 46 | Santiago Sacatepequez | 24,099 |
| 47 | La Gomera | 23,890 |
| 48 | Santa Cruz del Quiche | 23,507 |
| 49 | Nebaj | 23,190 |
| 50 | Tecpan Guatemala | 21,867 |
| 51 | Sumpango | 20,773 |
| 52 | Comalapa | 20,627 |
| 53 | Esquipulas | 20,563 |
| 54 | Flores | 20,353 |
| 55 | Chicacao | 20,315 |
| 56 | San Pablo Jocopilas | 20,148 |
| 57 | Comitancillo | 19,558 |
| 58 | San Cristobal Verapaz | 19,553 |
| 59 | Gualan | 19,243 |
| 60 | Nuevo San Carlos | 19,051 |
| 61 | Colomba | 19,004 |
| 62 | Morales | 18,883 |
| 63 | Patzun | 18,593 |
| 64 | Puerto San Jose | 18,544 |
| 65 | San Andres Itzapa | 18,536 |
| 66 | Palencia | 18,463 |
| 67 | Tiquisate | 18,078 |
| 68 | San Lucas Sacatepequez | 17,848 |
| 69 | Jocotenango | 17,807 |
| 70 | Alotenango | 17,299 |
| 71 | Poptun | 17,209 |
| 72 | Chisec | 16,907 |
| 73 | Patzicia | 16,383 |
| 74 | Cuilapa | 16,373 |
| 75 | La Esperanza | 16,350 |
| 76 | Sanarate | 15,732 |
| 77 | El Estor | 15,731 |
| 78 | El Tejar | 15,659 |
| 79 | Asuncion Mita | 15,497 |
| 80 | Santa Maria de Jesus | 15,418 |
| 81 | El Palmar | 15,056 |
| 82 | Malacatan | 14,812 |
| 83 | San Sebastian | 14,712 |
| 84 | Santa Catarina Ixtahuacan | 14,623 |
| 85 | San Lucas Toliman | 14,434 |
| 86 | Livingston | 14,239 |
| 87 | San Pedro Sacatepequez | 14,204 |
| 88 | Patulul | 14,085 |
| 89 | Barillas | 13,989 |
| 90 | San Francisco Zapotitlan | 13,744 |
| 91 | San Miguel Chicaj | 13,636 |
| 92 | San Pablo | 13,557 |
| 93 | Guastatoya | 13,356 |
| 94 | San Pedro Carcha | 13,221 |
| 95 | San Mateo Ixtatan | 13,102 |
| 96 | Joyabaj | 13,053 |
| 97 | Santa Lucia Milpas Altas | 12,890 |
| 98 | Santa Barbara | 12,795 |
| 99 | Panajachel | 12,752 |
| 100 | Chiquimulilla | 12,731 |
| 101 | San Andres Xecul | 12,022 |
| 102 | El Quetzal | 12,011 |
| 103 | Sacapulas | 11,977 |
| 104 | Flores Costa Cuca | 11,873 |
| 105 | Salcaja | 11,855 |
| 106 | Cabrican | 11,835 |
| 107 | San Juan Chamelco | 11,833 |
| 108 | Almolonga | 11,802 |
| 109 | Chajul | 11,546 |
| 110 | Atescatempa | 11,432 |
| 111 | Melchor de Mencos | 11,346 |
| 112 | Ciudad Tecun Uman | 11,321 |
| 113 | Nueva Concepcion | 11,010 |
| 114 | San Juan Cotzal | 10,935 |
| 115 | San Antonio Suchitepequez | 10,840 |
| 116 | Soloma | 10,805 |
| 117 | Cuyotenango | 10,714 |
| 118 | Santa Catarina Mita | 10,706 |
| 119 | Rabinal | 10,626 |
| 120 | Dolores | 10,493 |
| 121 | Jalpatagua | 10,358 |
| 122 | Pastores | 10,282 |
| 123 | Monjas | 10,240 |
| 124 | San Agustin Acasaguastlan | 10,224 |
| 125 | San Luis Jilotepeque | 10,195 |
| 126 | Oratorio | 10,044 |
| 127 | Nueva Santa Rosa | 10,019 |
| 128 | Masagua | 9,934 |
| 129 | Zunil | 9,875 |
| 130 | Huitan | 9,847 |
| 131 | San Martin Jilotepeque | 9,735 |
| 132 | Cubulco | 9,642 |
| 133 | San Pedro La Laguna | 9,570 |
| 134 | Parramos | 9,502 |
| 135 | Santa Ana | 9,412 |
| 136 | Ocos | 9,352 |
| 137 | Zaragoza | 9,250 |
| 138 | Zacualpa | 9,130 |
| 139 | San Cristobal Cucho | 9,041 |
| 140 | Sayaxche | 8,989 |
| 141 | Tactic | 8,888 |
| 142 | Samayac | 8,883 |
| 143 | Casillas | 8,859 |
| 144 | Yepocapa | 8,850 |
| 145 | Estanzuela | 8,826 |
| 146 | Concepcion Huista | 8,814 |
| 147 | San Felipe | 8,810 |
| 148 | Santo Domingo Xenacoj | 8,680 |
| 149 | San Raimundo | 8,578 |
| 150 | La Libertad | 8,535 |
| 151 | Chiantla | 8,354 |
| 152 | San Miguel Duenas | 8,313 |
| 153 | Cunen | 8,289 |
| 154 | Pajapita | 8,053 |
| 155 | Moyuta | 8,034 |
| 156 | Nuevo Progreso | 8,002 |
| 157 | San Jeronimo | 7,982 |
| 158 | Concepcion Chiquirichapa | 7,969 |
| 159 | San Luis Ixcan | 7,739 |
| 160 | Santa Cruz Balanya | 7,714 |
| 161 | San Antonio Aguas Calientes | 7,700 |
| 162 | San Antonio La Paz | 7,670 |
| 163 | Champerico | 7,650 |
| 164 | Rio Bravo | 7,457 |
| 165 | El Tumbador | 7,451 |
| 166 | San Miguel Siguila | 7,440 |
| 167 | Mataquescuintla | 7,428 |
| 168 | Chahal Guatemala | 7,354 |
| 169 | El Progreso | 7,239 |
| 170 | San Andres | 7,124 |
| 171 | San Vicente Pacaya | 7,051 |
| 172 | Chuarrancho | 7,038 |
| 173 | Santo Tomas La Union | 6,970 |
| 174 | Guazacapan | 6,969 |
| 175 | Acatenango | 6,939 |
| 176 | Santa Maria Chiquimula | 6,869 |
| 177 | San Carlos Sija | 6,720 |
| 178 | San Luis | 6,665 |
| 179 | Taxisco | 6,407 |
| 180 | La Libertad | 6,328 |
| 181 | Tacana | 6,327 |
| 182 | Teculutan | 6,296 |
| 183 | San Jose Acatempa | 6,256 |
| 184 | Santo Domingo Suchitepequez | 6,159 |
| 185 | San Bartolome Milpas Altas | 6,150 |
| 186 | Santa Cruz Naranjo | 6,143 |
| 187 | San Pablo La Laguna | 6,075 |
| 188 | El Asintal | 6,045 |
| 189 | Rio Hondo | 5,886 |
| 190 | San Jose Poaquil | 5,876 |
| 191 | Santa Rosa de Lima | 5,873 |
| 192 | Santa Cruz Verapaz | 5,732 |
| 193 | San Antonio Huista | 5,558 |
| 194 | Senahu | 5,522 |
| 195 | Magdalena Milpas Altas | 5,471 |
| 196 | Aguacatan | 5,461 |
| 197 | San Mateo | 5,423 |
| 198 | San Bernardino | 5,390 |
| 199 | La Democracia | 5,368 |
| 200 | Purulha | 5,259 |
| 201 | Santa Clara La Laguna | 5,195 |
| 202 | Ipala | 5,172 |
| 203 | San Andres Villa Seca | 4,991 |
Ethnicity
Census in 2018 defined 41.7 percent itself as Mayan (maya) or indigenous (indigen). The latter category also includes the groups xinca and garífuna. Together these groups 6.2 million people, of whom Xinca counts 264,000 and Garifuna around 20 000. The vast majority of the rest are mestizos; in Guatemala often called ladinos.
From ancient times, Ladinos was a term for Mayans who adopted Spanish language and European or modern way of life. Until the 1960s, it was official policy to encourage what was seen as a natural modernization of the country’s indigenous peoples. The term ladino thus also has a class-defined denomination, which means that many upper middle class and upwards see themselves as white (blanco or criollo) rather than ladino. Statistics that differentiate between ladino and white show that 18 percent of the total is white. The vast majority of these are descendants of Spanish colonizers, as well as of a small but significant group of Germans who arrived around 1900. Since then Guatemala has also received some immigration from the Middle East and Asia and El Salvador.
The 1994 peace treaties state that Guatemala is a multicultural society, and in 2003 these agreements gained the rank of constitution. In line with developments throughout Latin America, the divisions between the peoples (or “races”, as it was called around 1990) have become increasingly blurred and removed in all legislation, but the country continues to be a “racialized” society, that is, that the contrasts between Spanish speakers and Mayans or indigenous peoples characterize all social, political and economic life. Furthermore, the marked distinctions between different indigenous peoples are not visible from the outside.
Language
Spanish is an official language, but there are also a number of languages spoken by the Mayan family besides xinca (a language isolate) and garífuna (a Caribbean language). The Constitution states that these languages are also entitled to state protection, such as “cultural heritage”.
The Academy of Mayan Languages (ALMG) was established in 1990 and has the task of standardizing and regulating the use of Mayan languages. ALMG recognizes 22 different Mayan languages. The largest are k’iche ‘, mam, kaqchikel and q’eqchí which are used by 1.7 – 1.07 – 0.85 and 1.37 million people respectively. The distance between the Mayan languages is the same as between the Germanic languages, and many of the 22 are considered dialects by each other. Several of the small Mayan languages (for example, itza in Petén and ch’orti in eastern Guatemala), besides xinka, are spoken by so few that they are considered endangered languages.
City and country
Guatemala is the least urbanized country in the Western Hemisphere. Around half of the population lives in one of approximately 9000 hamlets with small, family-run farms. This is especially true of the Mayan groups in the highlands west and north of the capital Guatemala City. However, especially after the end of the civil war, urbanization has accelerated here as well. More and more Mayan borders are becoming increasingly interwoven into the national and international economy. The rural communities assume the character of being urban.
The white minority dominates economics and politics while the vast majority of Mayans and other non-whites are poor and participate little in national political life. However, from around 1990, the Mayans in the highlands have increasingly established themselves in regional economy and trade, as well as in local politics. However, when it comes to access to public services such as education and health, as well as in national politics and culture, indigenous people are discriminated against. On the other hand, most Mayan societies maintain their own traditions with a locally rooted political and cultural autonomy. In practice, they are the so-called ‘maya municipalities’ (alcaldías indígenas) to a considerable extent recognized by government agencies. In primary school, bilingual education (Spanish plus the local Mayan language) is becoming more prevalent after such programs were approved in 1987.
With its 2.8 million residents in the city center and surrounding areas, Guatemala City is by far the country’s largest urban area and the country’s industrial, financial, administrative and communications center. The city is also the largest in Central America. The second largest city, Quetzaltenango (Xelajú), with approximately 300,000 residents, is the economic center of the Mayan highlands in the west. From ancient times, the city also has a middle and upper class of Mayans (k’iche ‘). To some extent this is also the case in Copán, the dominant city in the northern highlands (q’eqchí).
Religion
Guatemala has been a secular state since 1879 and the state does not keep church membership statistics. However, Catholicism has dominated the country from the Spanish conquest and Christianity in the 16th century to the present day. Catholicism practiced in Guatemala has been largely mixed with elements of Mayan religion. As in Latin America, the Church, through the Catholic Action (Acción Católica) in the 1950s, initiated a large-scale reform effort to answer the social questions of modernity and to fight syncretism.
The first evangelical (Protestant) missionaries came from the United States at the invitation of President Jorge Ubico Castañeda in the 1930s, but not until the 1980s, during the Civil War, did their work accelerate. The Pentecostal churches in particular, with their decentralized structure, have had success. A large survey from 2015 found that 45 percent of the people consider themselves Catholics, 42 percent as Protestants (evangelicals), while 11 percent say they have no religion. How Many Follow Mayan Religion – A Shamanic Type – is difficult to say, as very many consult Mayan priests besides participating in Christian congregation life (or one perceives an unorganized religious life as having no religion).
In addition, there are smaller groups of Orthodox Christians as well as Muslims and Jews.
For the country’s Catholics, Easter is by far the most important holiday. The processions in Antigua Guatemala are one of the country’s foremost cultural institutions.
The Esquipulas Cathedral (Basilica) is the country’s largest church and the most important pilgrimage destination in Central America. Each year, 5.5 million pilgrims visit the site to see and pray to the statue of the Lord of Esquipulas. The statue was created in Antigua in 1594 and shows a black savior.
Emigration
It is estimated that between one and a half and a million Guatemalans live in the United States as labor migrants or refugees, and somewhere between 15,000 and 35,000 are in Canada. The influx of migrants is linked to the civil war of the 1980s and the economic development has since been too weak to capture population growth.


